A Two-Miles-per-Hour World
The following series of maps depicts the speed at which news traveled to Venice, fron 1500 to 1765. The isochronic lines represent one week, and give a broad indication of the time required for letters to reach their destination. All three maps describe the speed of letters traveling toward Venice.
The differences from one map to another may seem very marked in certain directions. They are a result of the varying frequency of communications, depending on the urgency of the circumstances. Generally speaking, communication seems to be as slow on the third map as on the first, while the second shows noticably shorter delays. But as the French historian Fernand Braudel pointed out, it cannot be regarded as definitive proof. Theoretically, speeds should be compared over distances defined by comparable isochronic lines. However, if one images the maps as being superimposed on one another, they are very roughly equivalent, an extension in one direction being compensated by a reduction in another.
.jpg) |
|---|
.jpg) |
.jpg) |
This map also represents travel times, but by expressing geographic forms in relation to the time it took to reach them from Cadiz in the sixteenth and seventeenth centuries. The maps are based on the records of the Casa de Contratación ("House of Trade") in Seville, an royal agency with authority over all trade between Spain and its colonies oversees. All shipments of gold and silver from the American colonies were supposed to flow through the Casa, but of course a large volume seeped into circulation without passing through Seville. Even so, the records provide an microscopically detailed picture of Atlantic seafaring in early modern centuries.
.jpg)
Source: Pierre Chaunu and Huguette Chaunu, Séville et l'Amérique aux XVIe et XVIIe siècles (Paris, 1977), 238-9.
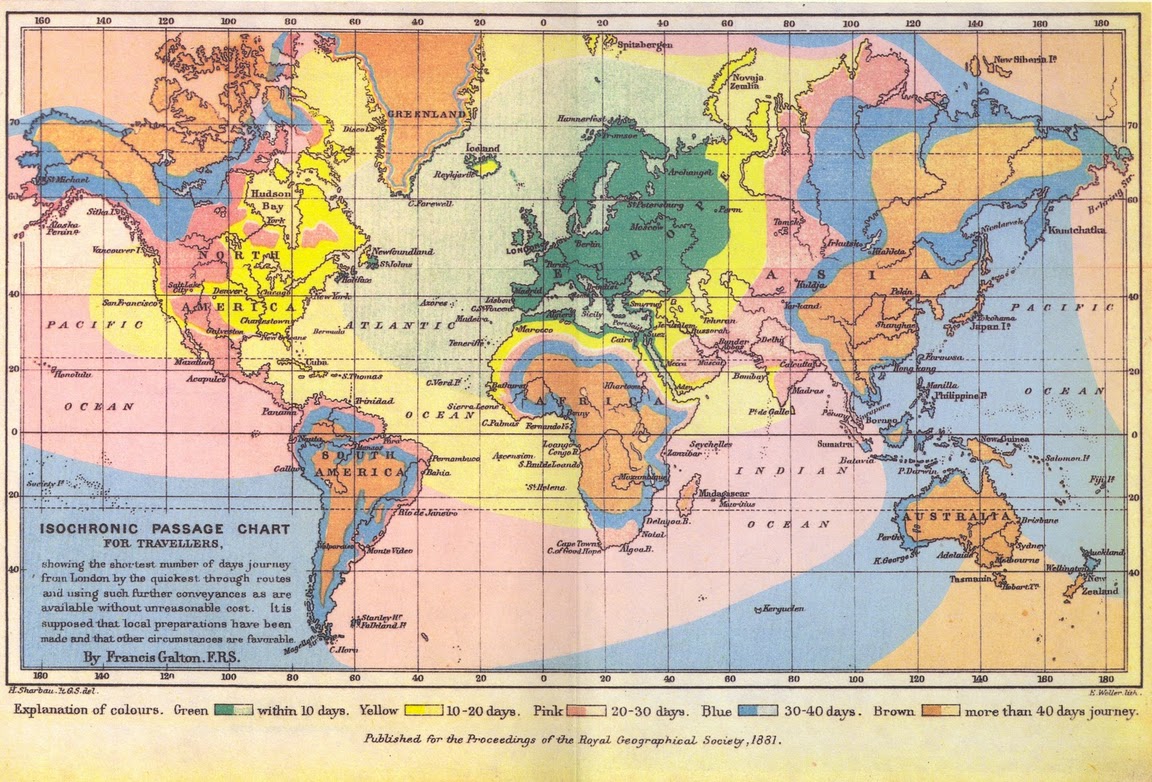
For the sake of comparison, consider this isochronic map of the world, made by Francis Galton well into the era of railroad travel and engine-powered shipping (1881). The green zone represents that portion of the globe that could be reached from London within ten days' travel; yellow corresponds to ten-to-twenty days; pink 20-30 days; and so on in ten-day increments up to 40+. Our pace would seem as fast to Galton as the pace of travel in 1881 would have seemed to sixteenth-century Europeans.
Return to 301 Homepage