Week 6: The Crisis of the Seventeenth Century
Discussion: The War
over Women
Read and discuss:
1. Joseph Swetnam, “The
Arraignment of Lewd, Idle, Froward, and Unconstant Women” (c. 1615)
[Also available on Canvas]
2. Rachel Speght, “A Mouzell for Melastomus”
(1617) [Also available on Canvas]
The
Challenge of Calvinism
I. A Second Reformation? II. The Wars of Religion
in France (1562-1598) Image: “A survey, or Table declaring the order of the causes of Salvation and Damnation” Map: Image Breaking in the Netherlands, 1566 Image:
The Death of Henri II (10 July 1559) Image above: The City of Geneva and its Environs (1552). Source: Sebastian Münster, La Cosmographie Universelle (Basel: Petri, 1552). Image source: Historic Cities. Image right: Jean Calvin (1509-1564) |
Identifications: Predesination Henri
II, King of France (1510-1559, r. 1547-1559) Charles
IX, King of France (1550-1574, r. 1560-1574) Massacre
of Vassy (1 March 1562) Image right: Francois Dubois, Le massacre de la Saint-Bathélemy (ca. 1572-1584). Oil on panel, 94 x 154 cm. Musée cantonal des Beaux-Arts, Lausanne. Image source: Wikimedia Commons. |
Was There a General Crisis in the Seventeenth Century? I. Environment: An Age of Global Cooling Graph: Wine Harvest Date in Northern
Switzerland, 1525-1800 II. Economy: Price
Inflation Image: The King of Mali (1375) III. State and Society |
|
Identifications
English
Revolution (1640-1660) “Little Ice Age”
|
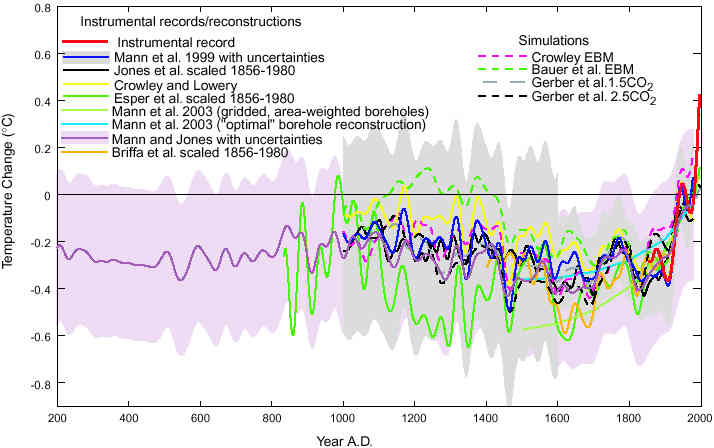
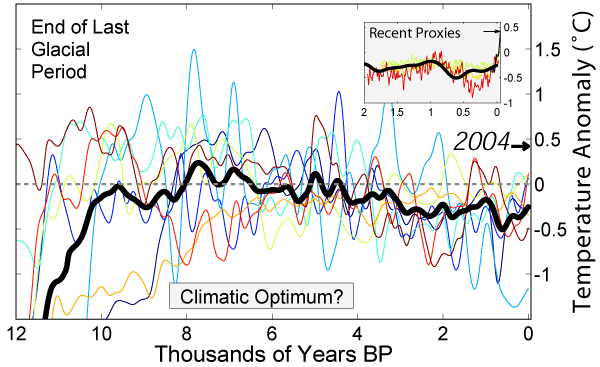
This figure shows a comparison of proxy-based Northern Hemisphere temperature reconstructions, showing model simulations of mean temperature changes over the past millennium. Also shown are two independent reconstructions of warm-season extratropical continental Northern Hemisphere temperatures and an extension back through the past two thousand years based on eight long reconstructions. Image source: NOAA. This figure shows eight records of local temperature variability on multi-centennial scales throughout the course of the Holocene, and an average of these (thick dark line) to 10,000 BCE (from 12,000 BP to the present). The records are plotted with respect to the mid-twentieth century average temperature, and the global average temperature in 2004 is indicated. An inset plot compares the most recent two millennia of the average to other recent reconstructions. At the far right of this plot it is possible to observe the emergence of climate from the last glacial period of the current ice age. During the Holocene itself, there is general scientific agreement that temperatures on the average have been quite stable compared to fluctuations during the preceding glacial period. |
Image: A cross section of fortifications in the new style, as
conceived by Philip Staynred in A Compendium of Fortification: Both Geometrically
and Instrumentally by a Scale (London, 1683). Image source: The Geometry of War, 1500-1750.