|
The Local Setting of the Galapagos Archipelago Galapagos Data 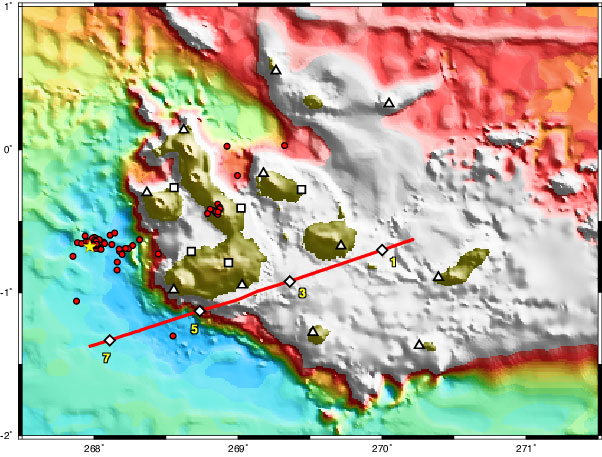 | | A local view of the Galapagos Archipelago. The white squares and triangles are land seismometers used to record seismic waves from earthquakes. The white diamonds are seismometers that were placed on the ocean floor to record human induced seismic waves (see next page), used to map the crust and mantle. The red refraction line and yellow numbers correspond to the cross-section on the next page. The red circles are earthquake epicenters and the yellow star marks the epicenter of a larger earthquake. Bathymetric data compiled by William Chadwick, Oregon State University. |
Although several previous studies of the seismicity of the Galápagos hotspot have been made, little is known about the regional stress field or the neotectonics of the area. Due to the proximity of the Galápagos Spreading Center, the Galápagos platform is built upon very young oceanic lithosphere (<10 m.y.). Main tectonic features of the Galápagos are (1) a N-S fracture zone that crosses the platform and creates a 5.m.y. age offset in the lithosphere, (2) a pronounced NW-SE lineament (Wolf-Darwin Lineament), (3) a series of NW-SE and NE-SW lineaments and volcano alignments (Darwinian trends) on the western part of the archipelago, and (4) steep escarpments along the western and southwestern margin of the platform. The latter are accompanied by a flexural moat and a bathymetric bulge, both of which are absent on the northwestern and eastern margins. The purpose of this study is to correlate this tectonic setting with local seismicity.
We report epicenters of earthquakes registered by a seismic network deployed in the Galápagos since September 1999. The network consists of ten broadband seismometers and one GSN station, in an array that is over 300 km by 200 km in aperture. During the first year we located 56 events (ml>2.2), using a 1-D velocity model for the platform that assumes a crustal thickness of 15 km. The largest event (5.1 mb) occurred at December 22, 1999 22:08, and was located 40km west of the Archipelago, on the flexural moat. It was followed by 47 aftershocks in the next six months. The Harvard Centroid Moment Tensor for the main event indicates a strike-slip movement with nearly east-west compression. This is in accordance with solutions of previous events in the area, suggesting a constant stress field orientation. The strike of one of the assigned fault planes (295°) is close to the alignment of the epicenters of the aftershocks. We suggest that these events are very closely associated with the flexure of the lithosphere that fractures in response to the loading stress resulting from volcanic construction. Three events (ml=2.3-3.1) were located between northern Isabela Island and the Wolf-Darwin Lineament, on the limits of the platform. The other five events (ml=2.2-2.9) occurred close to the active Alcedo Volcano, and are probably related to its volcanic activity. However, our locations still lack good depth constraint and need to be improved. This data set will be complemented with two more years of data and records from the high frequency stations operating in the area. Ongoing analysis includes obtaining improved locations using a 3-D velocity model that includes topography, and new moment tensor and fault-plane solutions using the stations in our array. The analysis of this seismicity will establish the regional stress field orientation, local stresses in the vicinity of active volcanoes, the role of faults controlling structural and volcanic features, and seismicity related to volcanic activity in the archipelago.
|