|
The Local Setting of the Galapagos Archipelago Galapagos Cross-Section 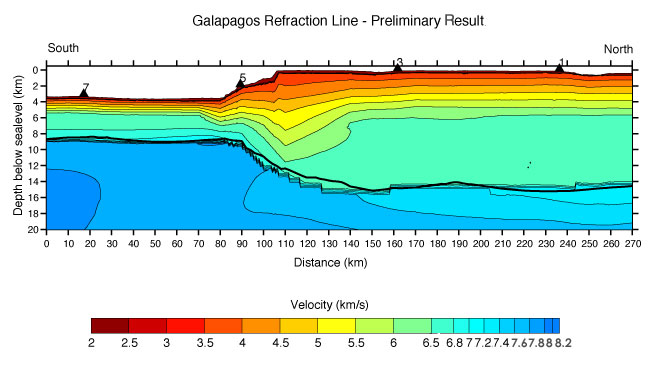 | | This is a cross-section of the Galapagos Refraction Line, noted by the red reference line in the previous map. The numbers 1, 3, 5, and 7 correspond to the numbers on the previous map. |
The above figure displays a cross-sectional view of the preliminary velocity model and crustal thickness (dark black line) across the Galapagos region. The data is collected from experiments set up on a sea surface craft that release high pressure airgun shots to the bottom of the ocean floor. These instruments cause spherical shaped seismic waves to penetrate the earth. Next, ocean bottom hydrophones and land seismometers record the arrival of the seismic waves projected throughout the crust, mantle, and core. By evaluating the relative time delay from the original location and destination of multiple seismic waves, geologists can determine the velocity gradient (the various speed at which a seismic wave travels through a certain material) and the crustal thickness.
The above figure records the distance on the refraction line in kilometers. Water depth is shown by white. The triangular markers (labeled 1, 3, 5, and 7) correspond to the seismometers that record the seismic waves. Through noted observations of the graph, speculations on crustal thickness, lower crustal thickness and velocity, and low crustal velocities beneath the edge of the Galapagos platform can be inferred.
Crustal thickness varies from about 15 km beneath the Galapagos platform to 5.5-6 km on the oceanic crust beyond the edge of the platform. By comparing the thickness of the oceanic crust to the thickness of the crust overlaying the mantle plume, it shows how much excess magma is emitted from the Galapagos mantle plume.
Lower crustal thickness is about 2/3 of the total crustal thickness both beneath the platform and beyond its edge. This indicates that the ratio of internally cooling to externally cooling magmatic construction of the crust is the same for the crust generated at the mid-ocean ridge as for the additional volcanism that takes place over the hotspot. However, lower crustal velocities are lower beneath the platform than for the oceanic crust (6.5-6.8 km/s vs. 6.5-7.0 km/s), as to be expected, because of the extended range of the crust.
Crustal velocities are substantially lowered from distances 80-130 km along the line. This corresponds to the edge of the platform and appears to extend into the platform due to the oblique angle that the seismic line makes with the edge. The most likely explanation for these observations is significant faulting associated with the edge of the platform, which is supported by the extremely steep topography found here.
|