COOL AT THE TOP - ECS CASE STUDY 2007
| Results |
Figure 1 Study of Airspeeds throughout the library for four different days. Measurements were taken at 26 locations throughout the library-four on each floor and eleven in the stairway. Airspeeds were measured twice and averaged at each location. The graph illustrates the variation between locations and pattern across the four days.
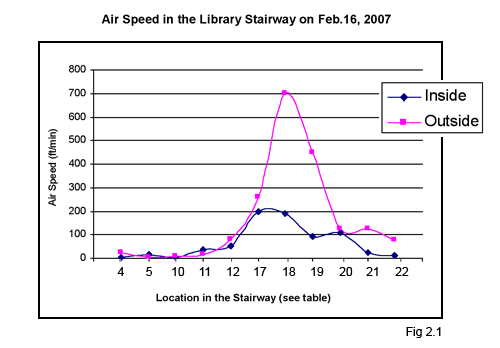
Figure 2.1 Airspeed Data of the Inner and Outer Perimeter of the Stairway. Measurements were taken on February 16, 2007 from 10:00 to 11:00. Locations in the stairway are numbered and charted above.
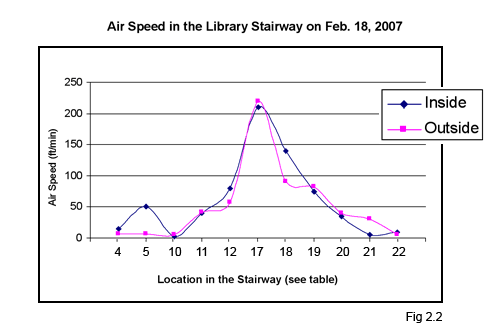
Figure 2.2 Airspeed Data of the Inner and Outer Perimeter of the Stairway. Measurements were taken on February 18, 2007 from 11:30 to 12:30. Locations in the stairway are numbered and charted above.
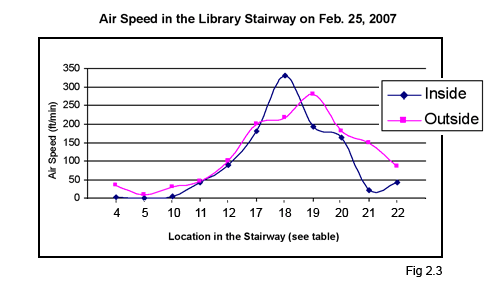
Figure 2.3 Airspeed Data of the Inner and Outer Perimeter of the Stairway. Measurements were taken on February 25, 2007 from 15:30 to 16:30. Locations in the stairway are numbered and charted above.
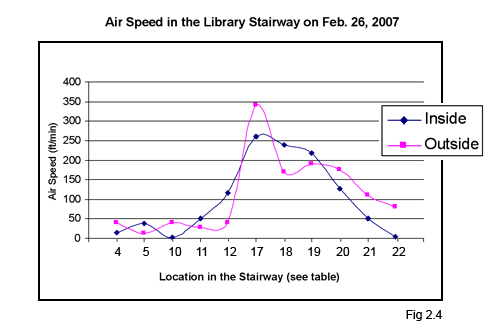
Figure 2.4 Airspeed Data of the Inner and Outer Perimeter of the Stairway. Measurements were taken on February 26, 2007 from 10:30 to 11:30. Locations in the stairway are numbered and charted above.
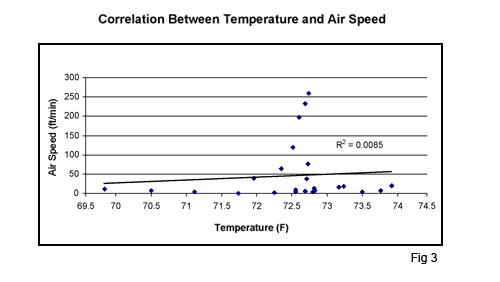
Figure 3 Linear Correlation Test Between Temperature and Air Speed. At each location of measurements both temperature and air speed were taken. For a linear correlation, the R-squared value indicates the existence or lack of a correlation. An R-square value close to 1 or -1 shows a positive or negative relationship between two data sets, while a value close to zero disproves a linear correlation. This graph and its regression line, shows the lack of a correlation with an R-square value of 0.0085.
|
