This is the HTML version of a Mathematica 8 notebook. You can copy and paste the following into a notebook as literal plain text. An executable notebook is linked here: PoissonDielectricSolver2D.cdf.
This web page is intended for educational use and copyright Jens U. Nöckel (2011). No claims are made as to the accuracy and reliability of the results. Any commercial use requires the permission of the author. There are no restrictions on personal or educational use, but also no warranties.
The notebook implements a relaxation procedure to determine the potential in the presence of arbitrarily shaped conductors, linear dielectrics, and charges. No iterative refinement or other numerical optimizations are performed. The goal is to keep the code as simple as possible while still allowing it to cover a wide range of problems in planar electrostatics with a simple user interface.
The main Mathematica-specific innovation in this code is the fact that you can create all the objects defining the problem by drawing them graphically. This drawing process is completely decoupled from the actual calculation, so it could in principle be done in any external program. However, I will use Mathematica's graphics commands to set the stage in the example below.
defaultGridSize = 120;

step = Compile[{{phi, _Real, 2 }, {orig, _Real, 2 }, {mask, _Real,
     2 }, {dchiX, _Real, 2 }, {dchiY, _Real, 2 }},
   Module[{f = (RotateRight[phi] + RotateLeft[phi] +
          RotateRight[phi, {0, 1}] + RotateLeft[phi, {0, 1}])*mask +
       orig, ex, ey},
    ex = (RotateRight[phi, {0, 1}] - RotateLeft[phi, {0, 1}]);
    ey = (RotateRight[phi] - RotateLeft[phi]);
    f - (dchiX*ex + dchiY*ey)*mask
    ]];

iterate = Compile[{{gridArray, _Real, 2 }, {originalArray, _Real,
     2 }, {maskArray, _Real, 2 }, {dchiX, _Real, 2 }, {dchiY, _Real,
     2 }, {tol, _Real}},
   FixedPoint[step[#, gridArray, maskArray, dchiX, dchiY] &,
    originalArray, 100000,
    SameTest -> (Max@Abs@Flatten[#1 - #2] < tol &)]];

digitize[gr_, n_] :=
  N@ImageData@
    ColorConvert[
     Image[Show[gr, Background -> Black,
       BaseStyle -> {Antialiasing -> False}], ImageSize -> n],
     "GrayScale"];

createLandscape[conductors_, chargePlus_, chargeMinus_,
   suceptibility_, nGrid_] :=
  Module[{gridConductors, gridRho, gridChi, maskList},
   gridConductors = digitize[conductors, nGrid];
   maskList = N[1. - Unitize[gridConductors]];
   gridRho = (digitize[chargePlus, nGrid] -
       digitize[chargeMinus, nGrid])*maskList;
   gridChi = digitize[suceptibility, nGrid]*maskList;
   {gridConductors, gridRho, gridChi, maskList}
   ];

poissonSolver[conductors_, chargePlus_, chargeMinus_, suceptibility_,
   nGrid_: defaultGridSize, tolerance_: 10^(-6)] :=
  Block[{averagePotential, gridConductors, gridRho, gridChi, gridEps,
    gridList, maskList, mask4List, dChiYList, dChiXList,
    initialGrid},
   {gridConductors, gridRho, gridChi, maskList} =
    createLandscape[conductors, chargePlus, chargeMinus,
     suceptibility, nGrid];
   averagePotential = Mean[Select[Flatten@gridConductors, Positive]];
   initialGrid = averagePotential*maskList + gridConductors;
   gridEps = 1. + gridChi;
   gridList = gridConductors + gridRho/(4.*gridEps);
   mask4List = maskList/4.;
   dChiYList = (RotateLeft[gridChi] - RotateRight[gridChi])/(
    2. gridEps);
   dChiXList = (
    RotateLeft[gridChi, {0, 1}] - RotateRight[gridChi, {0, 1}])/(
    2. gridEps);
   Reverse@
    iterate[gridList, initialGrid, mask4List, dChiXList, dChiYList,
     tolerance]
   ];
The function poissonSolver takes four two-dimensional graphics objects (all must correspond to a spatial area of equal dimensions), and outputs a two-dimensional array of horizontal dimension nGrid. If the graphics are not square, the vertical dimension is adjusted to maintain the same aspect ratio as the input graphics.
All the ingredients are supplied separately as 2D Graphics objects:
conductors (black = no conductor, all other GrayLevel values give the value of the fixed potential). The potential on each conductor should be constant. Because I use GrayLevel to encode the potential, all potentials are positive (as can always be arranged with a suitable additive constant).
chargeMinus (black = zero charge, white = large negative charge)
chargePlus (black = zero charge, white = large positive charge)
susceptibility (susceptibility; black = 0)
In the function digitize above, we create all the grids needed for the simulation. A mask is applied to zero out all charges and susceptibilities that coincide with a conducting region.
digitize for this example is given below:
conductors = Graphics[{
    {GrayLevel[.5], Rectangle[1.1 {-1, -1}, 1.1 {1, 1}]},
    {Black, Disk[{0, 0}, 1]}, {GrayLevel[.1],
     Disk[{-.25, 0}, .15]}, {GrayLevel[1], Disk[{.1, -.25}, .1]}
    }, PlotRangePadding -> 0, ImagePadding -> None];

chargePlus =
  Graphics[{{GrayLevel[.1], Disk[{-.5, .3}, .05]}},
   PlotRange -> (PlotRange /. FullOptions[conductors])];

chargeMinus =
  Graphics[{{GrayLevel[.1], Disk[{0., .4}, .05]}},
   PlotRange -> (PlotRange /. FullOptions[conductors])];

susceptibility =
  Graphics[{GrayLevel[.4], Rectangle[{0.3, -1}, {1, 1}]},
   PlotRange -> (PlotRange /. FullOptions[conductors])];

FlipView[MapThread[
  Column[{Style[#1, FontColor -> Blue, FontFamily -> "Helvetica"],
     ImageAdjust[
       Show[#2, Background -> Black]]}] &, {{"conductor potentials (click to flip)",
    "dielectric susceptibility", "positive charges",
    "negative charges"}, {conductors, susceptibility, chargePlus,
    chargeMinus}}], Background -> Orange]
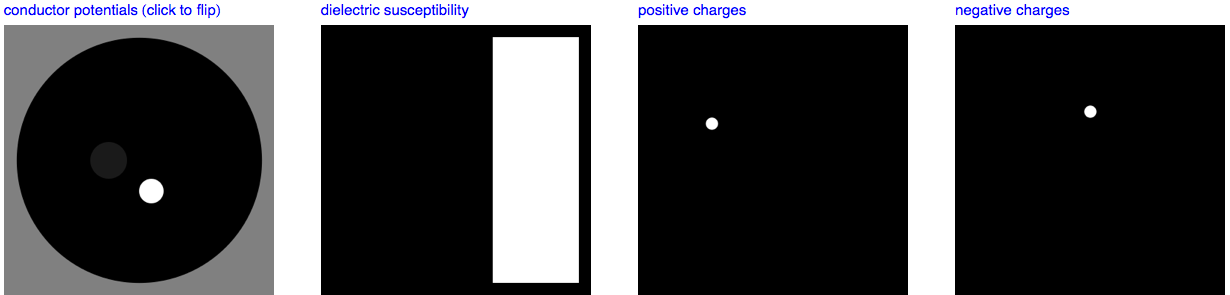
This shows the superposition of all four images, to illustrate (from left to right) the relative position of conductors (a round boundary in gray surrounding one bright and one almost black disk), the dielectric (a bright rectangle) and charges: there is one image for positive and one for negative charges, so that I can keep the convention that black corresponds to zero charge (black means zero in all images, except for the conductors where black means simply the absence of conductors). In the last two images, the charges are small disks. In the conductor configuration, the gray boundary represents a hollow conductor that provides a Dirichlet boundary condition which we can consider the "ground" level with respect to which the potentials on the other two conductors are measured.
Finally, we run the simulation and plot it. The optional Timing command yields 3.2s on a Macbook Pro with a 2.4 Ghz Intel Core I7.
Timing[potential =
   poissonSolver[conductors, chargePlus, chargeMinus,
    susceptibility];]

ListPlot3D[potential, PlotRange -> All,
  PlotStyle -> {Orange, Specularity[White, 10]}]

The charges create the two spikes, and the conductors create flat plateaus. A kink in the potential can be seen at the dielectric interface.