| Processing | LESSON 1 |
A first step into visual programming... |
STEP 1: The Interface |
The Processing Interface is clean, simple and fast. Here is the screen when you create a new document: Notice that there are only 7 interface buttons and the file menu header. This is very clean and simplified when compared to the Adobe line of software products. Here is what the seven buttons do:
|
| STEP 2: Your FIRST Program |
Let's jump right in and write our first program. In Processing we first define the size of our SKETCH (what processing calls a program that you write). size(800,600); This creates a canvas that is 800 pixels wide and 600 pixels high. See more here. While we are at it, let's define the background color of this new canvas. To change the background color we use the line: background(50); OR background(220, 25, 65);
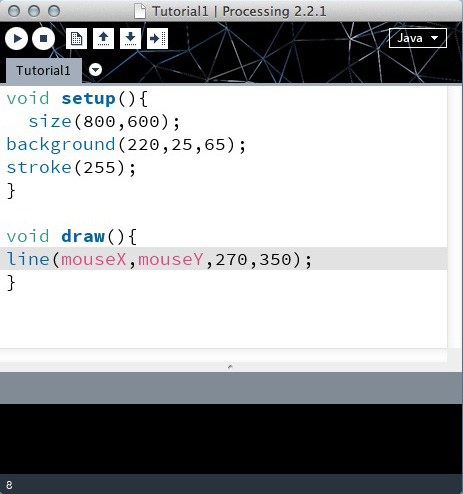
! NOTE !: part of the syntax of this programming language (and most other computer languages) is that you add a semiColon at the end of each line. Go back and notice the semicolon after the size line and the background line. Now your window should have two lines of code like the below image: Now hit the
|
STEP 3: Adding more elements to your Program |
Now let's start talking about adding some elements to your program. We will start with one of the simplest elements of all, the LINE. line( x1, y1, x2, y2); So more specifically, let's add a line() to our sketch. line(150, 25, 270, 350); But before drawing a line, let's define what kind of stroke the line will have. This will tell processing the color of the line, and if we want the opacity as well. So prior to the LINE code, we will add: stroke(255); This tells processing that our line will be WHITE. Try changing the values. The resulting sketch looks like this: Now go ahead and experiment changing the values and/or by adding multiple lines of the LINE(X1,Y1,X2,Y2); code. |
STEP 4: Injecting some interactivity |
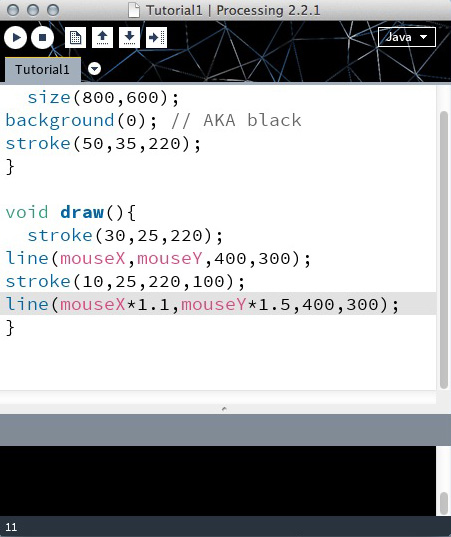
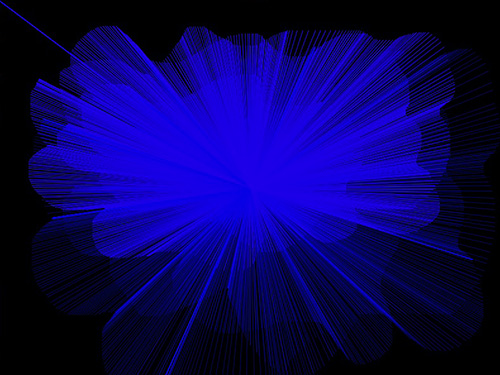
So far we only have STATIC images with these lines. Let's use the USER's mouse position to stand in for one of the points: line(mouseX,mouseY,250,150); Make sure to pay attention to case sensitivity. As you will see, the command mouseX and mouseY will use the X and Y mouse position. If we insert the above line of code into our program then we only get that line once. What if we want to constantly get new lines...to have Processing actively update? This is where we introduce a new concept...functions. Next we will use two simple functions that work very differently. A FUNCTION is a set of lines of code that can be can be called over and over again. Here we will use two already defined functions. One is called setup() and the other is called draw(). It is easy to remember that setup() only runs once. This is where you can initialize settings such as size(x,y) or stroke(x). The function draw() on the other hand runs repeatedly at frame rate. The default framerate is 60 frames per second. We will start writing our function with the word void because our functions will not return any values. Also, after the open and close parentheses that follow the function name, we will open a curly bracket like this: { After the curly bracket you can put as many lines of code as you wish. When you are finished writing your lines of code, you can CLOSE THE FUNCTION with a close curly bracket symbols like this: } If this sounds confusing, look at the syntax (or format) of the following code: Now that you know this, see how we can create an interactive sketch? One end of each line draws where you mouse is and the other end draws at 270 pixels in the X-axis and 350 pixels down in the Y-axis. This operation repeats at 60 frames per second. Example result: The above code makes some changes. One of the them is the stroke. If you put 3 different number values followed by commas, Processing knows you are talking about an RGB value. If you put a fourth value in their it knows you are talking about an alpha channel value (or transparency). So by using a stroke value of stroke(10, 25, 220, 100); I am saying a line that is 10 Red, 25 Green, 220 Blue and 100 Alpha. All of these values range from 0-255 (8 bit numbers). |
STEP 5: Where to go from here |
You now know enough to experiment. Here are some commands that will get you more interesting shapes: CURVES: FILL, STROKE, noFill(), etc ELLIPSES: Ellipse Example: INPUTS: See the Processing reference under the section called 'inputs' to see alternate functions. In particular try mouseMoved(); or mousePressed(); |
| If you feel comfortable with what you have learned thus far, check out more commands and functions that are built into the processing language at the official Processing.org Reference Section |


