|
Planning Analysis: |
Overview
Many communities engage in economic development activities. Developing effective economic strategies requires more than just ideas. Before engaging in economic development planning, the community should ask questions such as:
A number of basic analytical tools exist that can provide insight into these questions. None of these tools, however, will provide all the answers about what a community should do to achieve its economic goals. What these tools can do is to provide useful information on the characteristics of the local economy, which, in theory, should lead to better economic strategies.
This packet describes the following tools:
LOCATION QUOTIENT
Purpose
1. To determine a community's degree of self-sufficiency in a particular retail or trade sector.
2 To determine if a community is losing its local trade dollars to non-local markets.
3. To determine if a community is producing more than needed for its own use and is selling the excess to non-local markets, i.e., identify export activity.
Example
Business leaders in Riverside want to know if the community is self-sufficient in apparel and accessory stores.
Data Needed
1. The Standard Industrial Classification (SIC) Code for Sector J, (i.e., apparel and accessory stores). First, define the type of business to be investigated in terms of its Standard Industrial Classification (SIC) Code. These codes are published by the U.S. Department of Commerce and Labor. The local Job Service is likely to have a copy. Generally, three-digit SIC codes should be used to determine location quotients but usually is unavailable in smaller communities.
2.
The percentage of local labor force employed in Sector J, e.g., apparel and accessory stores. This percentage is determined by dividing the number of local people employed in Sector J by the total local employment. This employment information is available from the Job Service or Department of Labor or County Business Patterns. It is categorized in terms of SIC codes.3. The percentage of workers employed nationally in Sector J, (e.g., apparel and accessory stores). This information is available through Job the state Department of Labor. Another source is the Employment Earnings report published by the U.S. Bureau of Labor Statistics. County Business Patterns is also a potential source for state or national data.
How to Calculate Location Quotients
Location quotients are calculated by dividing the percentage of those employed locally in a particular sector by the percentage of those employed in the same sector nationally.
![]()
![]()
![]()
Interpretation
A location quotient of .94 for Riverside's apparel and accessory shops is almost one. It suggests the city is approximately self-sufficient in apparel and accessory shops. A location quotient generally between the values of .75 and 1.25 probably indicates the community is just self-sufficient. If three digit SIC codes had been used, the analysis might indicate self-sufficiency for men's clothing (SIC 561) but not women's clothing (SIC 562). This indicates the desirability of using at least three-digit SIC codes.A location quotient less than 1 suggests the community is not self-sufficient and may be able to supply locally what it previously imported. To make this judgement requires comparing location quotients among similar communities, plus examining the population-employment ratios and eventually doing feasibility studies.
EMPLOYMENT MULTIPLIER
Purpose
To determine how many new jobs will be created in a community resulting from an external economic change.
Example
A manufacturing plant in the City of Riverside expects to create 100 new jobs. Community leaders wonder how the manufacturer's expansion will affect total employment in the local economy. They decide to use the employment multiplier to estimate the total number of the new jobs in Riverside.
Data Needed
How to Calculate the Employment Multiplier
For simplicity, let us say Riverside has a two-sector economy. One sector is manufacturing and the other is trade. The information we need is:
| Sector | 1998 LQ |
1998 Employment |
| Manufacturing | 0.4 | 1,500 |
| Trade | 2.0 | 1,832 |
| Total | 3,332 |
![]()
For manufacturing, the proportion of manufacturing employment serving non-local needs is 1 – = ¼ = ¾ = 75 percent. There were 1,500 workers employed in Riverside manufacturing plants. Multiplying 1,500 workers by 75 percent, we find 1,125 workers are serving non-local needs. For the trade sector, 50 percent of the workers in that sector serve non-local needs, e.g., 1 - ½ = 50%. If we multiply 50% by the number of workers in that sector, we get 916. We add the number of workers in each sector serving non-local needs (1,125 + 916 = 2,041). In other words, 2,041 workers in the Riverside economy are serving non-local needs.
The employment multiplier is the total employment divided by the employment serving non-local needs, i.e., export.
![]()
![]()
Interpretation
The employment multiplier is 1.63. If the Riverside manufacturing plant creates 100 new jobs, there will be a total of 163 new jobs in the community, with 63 of the new jobs being created outside the manufacturing plant.INCOME MULTIPLIERS
Purpose
To determine the impact of an external economic change on a community's income.
Example
The community of Riverside anticipates that a large prison will be built at the edge of the city. How will the prison payroll affect community income? Riverside can get a rough answer to that question by determining its income multiplier.
Data Needed
An ability to make some accurate guesses about the local economy. To find the information you need for the income multiplier, you need to ask people familiar with the community's economy these questions:
A note of caution: never ask a community leader to estimate the entire income multiplier. Generally, they tend to overestimate it. Hence, it is wise to ask them questions (a) and (b) to estimate better what the multiplier is.
This could be done through a survey of local residents and merchants.
How to Calculate the Income Multiplier
![]()
The next question to ask is what proportion of local spending becomes local income? That is PSY in the formula. If local spending is for services such as restaurants, taverns, auto repair shops, and other types of labor intensive businesses the PSY may be as high as .50 to .60. However, if people spend the majority of their income on purchases with little local labor content (such as automobiles), the PSY may be as low as .25 etc,. Let us say the PSY is .45. Plugging the numbers into the formula our income multiplier is:
![]()
If the PSY is higher, e.g., .60 and the MPC is higher, e.g., 0.50, the multiplier becomes
![]()
Interpretation
The income multiplier of 1.18 suggests the total income change from the prison development is slightly greater than the prison's gross payroll. It means that for every prison payroll dollar, there will be a change of $1.18 in local income. The interpre- tation is similar for the multiplier of 1.43. The important point is the size of the multiplier is sensitive to estimates of MPCL and/or PSY.
POTENTIAL SALES
Purpose
To estimate the potential sales volume for a particular retail or service activity in the trade area.
Example
The City of Riverside wants to determine what proportion of potential new auto purchases it actually is capturing.
Data Needed
Calculating Sales Potential
The formula is:
![]()
![]()
![]()
The City of Riverside is capturing only 78.5 percent of its estimated potential sales in new automobile purchases. This could be due to a variety of reasons including non-aggressive local businesses, nearby competition, poor choice, and product selection etc. Note these numbers tend to support the insight gained from trade area capture, which indicated that the city was capturing only 17,680 customers out of the 22,500 in the trade area.
POPULATION-EMPLOYMENT RATIO
Purpose
To measure the number of people in the local market per job in a particular trade or service sector. It is used to make inter-community comparisons of trade and service sectors.
Example
The community of Riverside is interested in learning about its apparel and accessory sector (SIC code 56). Some people feel there is little room for expansion in this field. Others argue the community could support more apparel stores or existing apparel stores should expand. Riverside uses the population-employment ratio to compare its retail apparel sector with similar communities, e.g., Mountainview, Booneville, Forest Grove, and Porterville.
Data Needed
How to Calculate the Population-Employment Ratio
The population of a particular city or village divided by the number of people employed in a particular trade or service sector in that city yields the population-employment ratio.
![]()
The following data are needed to compute the ratios:
| City | Population |
Employment in Apparel and Accessory |
| Riverside | 7,052 |
224 |
| Forest Grove | 6,758 |
123 |
| Booneville | 7,826 |
175 |
| Mountainview | 3,246 |
71 |
| Porterville | 7,833 |
108 |
Riverside population-employment ratio:
Forest Grove population-employment ratio :
Booneville, Mountainview, and Porterville have population-employment ratios of 44.72, 45.69, and 72.53, respectively. The next step is to compute the average, which is 49.36.
Interpretation
On the average, each retail apparel store worker "sells" to about 50 people. However, in Riversi4e each retail apparel store worker only sells to about 29 people. Why does Riverside have such a low population-employment ratio? It could be because the local merchant is aggressive and is servicing a much larger nonlocal market, or the local merchant is over staffed. In any case, the population-ratio here does not suggest any room for expansion. This agrees with the location quotient analysis.
REILLY'S LAW
Purpose
To determine the maximum distance customers will travel to shop in a certain community. The information is generally used to develop a trade area map of the community.
Example
We want to know how far the trade area extends from the City of Riverside to the cities of Mountainview, Centerville, River Falls and Forest Grove.
Data Needed
1. Population of each city to be compared with our community, e.g., Riverside. Each state generally makes annual estimates of community population for various official purposes. Contact the local community or call a state office, such as the administration department or the sociology department of a nearby university for this information.
2. The road distance from our community, e.g., Riverside to similar cities surrounding it, e.g., Mountainview, etc. The distance between communities can be read from road maps.
| Cities | Population |
Distance from Riverside (miles) |
| Riverside | 7,052 |
0 |
| Mountainview | 3,260 |
23 |
| Centerville | 18,023 |
61 |
| River Falls | 3,346 |
31 |
| Forest Grove | 6,758 |
17 |
Reilly’s Law Formula
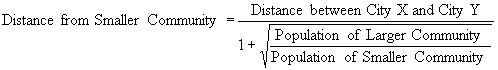
How to Calculate Trade Area Boundaries:
Compute the boundary between Riverside and Mountainview by plugging the numbers into the formula.
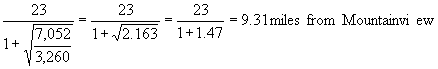
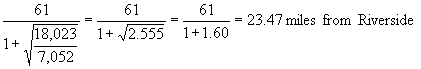
Interpretation
The Riverside-Mountainview result means the trade area for Riverside extends up to 9.31 miles from Mountainview. The people, who live within 9.31 miles of Mountainview, will be reluctant to shop in Riverside. The Riverside-Centerville comparison suggests that the trade area for Riverside extends up to 23.47 miles from the City of Riverside. Remember, the final number derived in the formula is the trade area boundary distance from the smaller community. After calculating the trade area distances for surrounding communities, connect the points. This yields a map of the trade area.The Riverside trade area map: (not drawn to scale)
Purpose
To tell how many customers are drawn to a particular community to shop for a certain type of product at any given time.
Example
The City of Riverside wants to know how many customers it has attracted in recent years. Riverside is especially interested in its auto dealers. They want to know if they lost or attracted more customers between 1993 and 1998.
Data Needed
How to Calculate Trade Area Capture


![]()
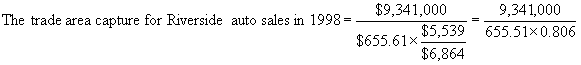
![]()
Interpretation
The 1993 figure means Riverside "captured" the auto purchases of 10,446 people. It does not mean they sold 10,446 cars. For example, if a family of five people purchased a car, they would be listed as five people in the trade area capture figure. The 1998 figure indicates Riverside served 17,680 auto customers. An increase of 7,234 people means Riverside has improved its ability to capture auto customers. Why did this occur? Could Riverside increase its auto customers more in the next five-year period? These are some of the questions the community might ask itself.
The trade area capture analysis can also be used for other retail sectors to understand community trade growth or decline. Below, the trade area capture for eating and drinking establishments and miscellaneous retail indicates there has been a loss in customers. Why did it occur? What can Riverside do to promote those two sectors? These are some of the questions that follow trade area capture analysis.
|
1998 |
|||
| Retail Category | Actual Sales
|
Trade Area Capture |
Actual Sales
|
Trade Area Capture |
| Food | 5,122 |
14,320 |
9,241 |
17,203 |
| Auto | 3,301 |
10,446 |
9,341 |
17,680 |
| Furniture | 1,527 |
19,489 |
2,603 |
21,922 |
| Eating and Drinking | 2,187 |
12,962 |
2,889 |
10,885 |
| Miscellaneous Retail | 1,300 |
7,399 |
1,599 |
6,113 |
| Total Retail | 22,505 |
13,500 |
37,971 |
15,270 |
* Includes categories not explicitly identified.
PULL FACTORPurpose
To determine the portion of customers a community draws from outside its boundaries. Pull factors should be compared over several time periods to determine trends. While not a general occurrence, the pull factor could be less than one.
Example
The City of Riverside wants to know what portion of its automobile customers are coming from outside its boundaries. They are interested if they have improved on their ability to attract outsiders between the years 1993 and 1998.
Data Needed
How to Calculate Pull Factors
To calculate a pull factor for a certain type of retail good, divide the trade area capture estimate by the community population for the same year as the trade area estimate:
![]()
![]()
![]()
Interpretation
Strictly interpreting a pull factor of one (1) it means the community is drawing all its customers from within its boundaries but none from the outside. A pull factor of 1.5 for 1993 Riverside auto sales means Riverside drew some customers from beyond the municipal boundaries. The proportion of non-local customers was equal to 50 percent of the Riverside population.The 1998 Riverside auto sales pull factor is 2.5. It means the city attracted outside purchases equal to 150 percent of the Riverside population. Thus, the city drew 10,598 customers from outside its boundaries and 7,065 customers from within the city limits.
The 1993 and 1998 pull factors of 1.5 and 2.5, respectively, indicate the community improved its ability to attract outsiders. Riverside needs to ask itself why this occurred. It should also ask similar questions if the pull factor declines.
A pull factor less than one suggests the community is not even capturing the shoppers within its municipal boundaries or they are spending relatively less than the state average.
SHIFT-SHARE
Purpose
To measure how many new jobs were created locally due to national economic trends.
Example
The community of Riverside has four sectors and wants to know if recent employment changes were due to national economic trends or other forces.
Data Needed
1. Workers employed in each sector both nationally and locally for at least two years. First, locate the SIC code of the industry or sector you want to study. This data is available from the U.S Department of Labor or Commerce and can be found at many libraries. The most accessible source is County Business Patterns. You need to compare data for two years. For example, you might want to compare the number of workers in 1980 and 1982 in a certain sector, e.g., SIC code 37, transportation equipment manufacturing. The number of workers employed locally in the same SIC and years you identified nationally is available from County Business Patterns which is published annually. Again, you will need data for two years. The State Department of Labor and Job Service can also be helpful in locating this information. Also, be sure to use data from the same sources to reduce potential error from differences in how the data was collected.
How to Calculate
Here is how the Riverside data looks:
U.S. Employment (000) |
Riverside Employment |
|||||
| Sector | 1990 |
1992 |
% Change |
1990 |
1992 |
% Change |
| A | 1250 |
2250 |
80.00 |
50 |
75 |
50.00 |
| B | 600 |
800 |
33.30 |
70 |
100 |
43.00 |
| C | 900 |
850 |
-5.55 |
80 |
50 |
-37.50 |
| D | 450 |
325 |
-33.30 |
65 |
180 |
177.00 |
| Total | 3200 |
4225 |
32.03 |
265 |
405 |
46.5 |
| Sector | Local 1990 Employment |
National Average Growth Rate |
National Growth Component |
|
| A | 50 | 32.03 | = | 16.02 |
| B | 70 | 32.03 | = | 22.42 |
| C | 80 | 32.03 | = | 25.62 |
| D | 65 | 32.03 | = | 20.82 |
Community National Growth Component |
= | 84.88 | ||
Interpretation
The community growth component of 84.88 means 85 of the 140 new jobs in the sectors A, B, C, and D were due to national economic trends. Thus, if the Riverside economy was like the national economy it should have grown by 85 jobs. Likewise, sector A would have grown by 16.02 jobs if it was like the national economy, etc.
INDUSTRIAL MIX COMPONENTPurpose
To determine whether the local economy is concentrated in industries that are growing slower or faster than the national average.
Data Needed
Same as the calculations of the national growth component.
How to Calculate
The industrial mix component is computed by multiplying the local employment in each economic sector by the difference in the national growth rate for that sector and the whole economy.
| Sector | 1990 Riverside Employment |
Sector’s National Growth Rate (%) |
National Average Growth Rate (%) |
Industrial Mix Component |
|||
| A | 50 | X | (80.00 |
- |
32.03) | = | 23.89 |
| B | 70 | X | (33.30 |
- |
32.03) | = | 0.89 |
| C | 80 | X | (-5.55 |
- |
32.03) | = | -30.06 |
| D | 65 | X | (-33.30 |
- |
32.03) | = | -42.46 |
Community Industrial Mix Component |
= | -47.65 |
|||||
Interpretation
The industrial mix component is negative. It suggests that Riverside's economy has 47.65 jobs less than it would have if its economic structure were identical to the nation. Sectors A and B are growing faster than the national average. However, that growth is offset by sectors C and D, which are growing slower than the national average. The negative industrial mix means that independent of national influences, the local sectors, on balance, grew slower than the national average and reduced local employment growth. Sectors C and D were the cause. If the industrial mix component were positive, it would suggest the local economy has relatively more people employed in fast growth sectors than the national average.
Riverside's negative industrial mix should lead the community to examine what is causing the slower growth. There are several reasons for a negative industrial mix. It could be a cyclic downtown. It could also be due to a shift in markets or depletion of a resource. The negative industrial mix means the community needs to consciously seek economic activity that will offset the declining sectors. At the very least, the community should not seek activity linked to the declining sectors.
It is important to note that not all sectors of the local economy had a negative industrial mix. The community needs to identify its faster growing firms/sectors to determine if these sectors are likely to continue contributing to local employment change.
COMPETITIVE SHARE COMPONENT
Purpose
To determine whether local businesses are growing faster or slower than similar businesses nationally, i.e., more/less competitive.
Data Needed
Same as for the calculations of the national growth component.
How to Calculate
The competitive share component is calculated by multiplying the local employment in each economic sector by the difference in the growth rate for that sector nationally and locally. The results for each sector are summed up to give the community's competitive share. The Riverside case illustrates how to compute competitive share.
| Sector | 1990 Riverside Employment |
Sector’s Local Growth Rate (%) |
Sector’s Average Growth Rate (%) |
Competitive Share Component |
|||
| A | 50 |
X | (50.00 |
- |
80.00) | = | -15.00 |
| B | 70 |
X | (43.00 |
- |
33.30) | = | 6.79 |
| C | 80 |
X | (-37.50 |
- |
-5.60) | = | -25.56 |
| D | 65 |
X | (-177.00 |
- |
-33.30) | = | 136.69 |
Community Industrial Mix Component |
= | 102.92 |
|||||
Interpretation
The competitive share component suggests that Riverside gained an additional 102.92 jobs beyond national growth trends and its industrial mix. It indicates that Riverside created a greater share of employment growth than other areas in the nation, i.e., more competitive. The contribution of each sector, both positive and negative, is worth noting.
Shift-share analysis does not provide the reasons local firms were more competitive. It may be due to better management, new technology, more productive workers or other factors. To make this judgement requires further analysis of local firms versus industry averages.
Special Note
A simple check of the calculations is the sum of national growth, industrial mix and competitive share must equal total local employment change:
140 = 84.88 + (-47.65) + 102.92 = 140.15
[Home | Syllabus | Schedule | Assignments | Project | Links]
This page maintained by Bob Parker,
©2002
October 21, 2003