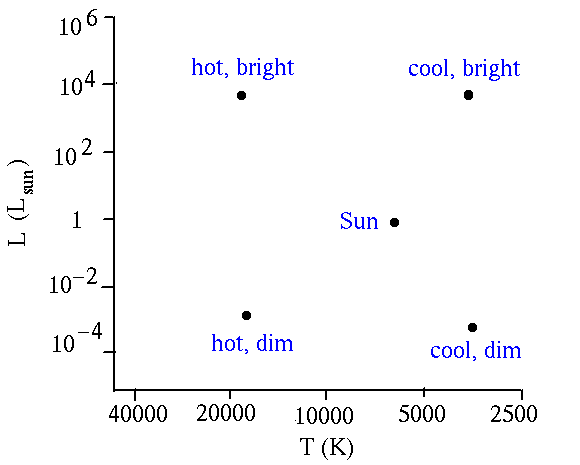
- This could be the luminosity in watts.
- More commonly it is in units of the Sun's luminosity.
- In either case, a ``ratio scale'' is used.
- Absolute magnitude is also commonly used.
- Sometimes this is labelled in by the temperature in Kelvins.
- Highest temperatures go to the left. (It's traditional.)
- Normally the temperature is given using a ``ratio scale.''
- Sometimes the stars spectral class (OBAFGKM) is used.
- One could also use a measure of color as seen through filters.
Other uses of scatter plots
The Hertzsprung-Russell diagram us an example of a scatter plot. Such plots are useful outside of astronomy too.What one sees in the HR diagram
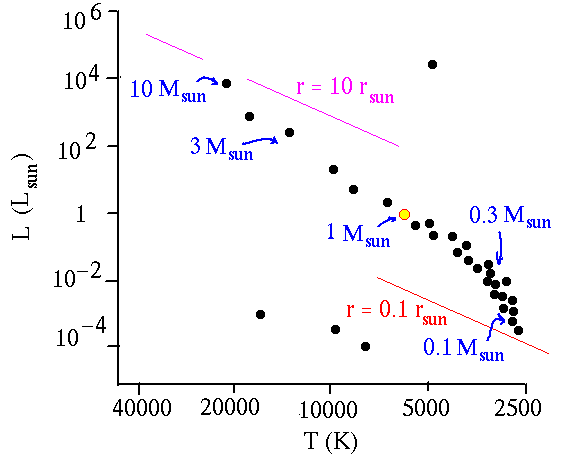
When data on the nearest stars to us or stars in a cluster are plotted in a HR diagram, here is what one sees.Brightness, size, and the HR diagram
We expect a relation between temperature and luminosity. How does that show up in the HR diagram?Mass and the HR diagram
There is a relation between mass and luminosity.Conclusion
Based on this evidence, we conclude- Stars spend most of their lives as main sequence stars.
- During its lifetime, the surface temperature and luminosity
stays pretty much constant.
- Something else could happen in the star birth process.
- Something else could happen in the star death process.
- The star's mass determines what the temperature and luminosity is during
the star's main sequence lifetime.
- More mass -> hotter.
- More mass -> more luminous.
- Also, more mass -> bigger.

Davison E. Soper, Institute of Theoretical Science, University of Oregon, Eugene OR 97403 USA soper@bovine.uoregon.edu
