Assignment 1
Hubble Law
Due: in class on 19 January 2012
Introduction
The Hubble Law is one of the fundamental pieces of observational evidence
upon which modern cosmological theory
(the Big Bang Theory)
is based. Here, we see how the Hubble Law was first found.
1. The first step is to determine the redshift of a set of galaxies.

 |

SpectrumThe above is a sample stellar spectrum.
Because the light from galaxies (in the
visual part of the spectrum) is
roughly the sum of the light from billions of stars,
normal galactic spectra will resemble those of a set
of stars. For stars like the Sun,
the two lines produced by Calcium II (ionized calcium), known
as the
H and K lines, are very strong and are expected to appear
prominently in galactic spectra. The wavelengths of these two
lines are 0.3934 and 0.3968 microns (1 micron = 10-6 meters)
for K and H lines,
respectively. In the spectrum above, the H and K
lines can be seen at the left end (the blue end)
of the spectrum. |
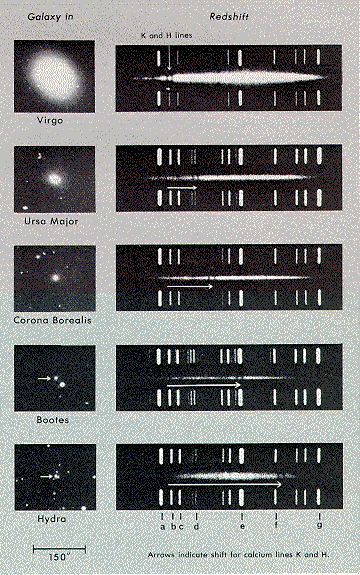
Get the redshifts for the following galaxy clusters
using the spectrum of the representative galaxy shown for each
cluster,

For the spectra shown above, note the following:
- The observed locations (wavelengths) of the
K and H
lines are marked by the head of the arrows (the right end of the
arrow).
- The
location of the rest wavelength of the lines is marked
by the left end of the arrow.
- The length of the arrow then gives
the difference in the observed wavelength of the
K and H
Ca II lines compared to the rest avelengths of the lines.
The redshift of a galaxy is defined as the relative change in the
wavelength of a spectral line of a given element. That is, we compare the
difference in the observed wavelength of a line and the rest wavelength of
the line to rest wavelength of the line.
The redshift z is then formally given by
 where the Greek letter lambda stands for wavelength.
- To calculate the redshift of each galaxy, first measure the
length of each arrow in centimeters.
- Next, note that the
positions marked by the letters a and e
on the spectra are
at wavelengths 0.3889 and 0.4472 microns so that points a
and e are separated by 0.4472 microns - 0.3889 microns
= 0.0583 microns.
- Use this information
and how far apart (in centimeters) a and e sit
to get the scale for the spectrum, that is, find out how many microns
correspond to each centimeter on the figure.
- The lengths of the arrows and the scale for the
spectra, determine the change in wavelength of
the K and H Ca II lines in microns.
- Fill in the
Change in K
and H wavelength, and Redshift
columns in the following Table.
For the
rest wavelength, use the average of the Calcium II K and
H lines, 0.3951 microns.
Galaxy Cluster | Change in K and H wavelength | Redshift | Distance |
Virgo | | | 59,000,000 ly |
Ursa Major | | | |
Corona Borealis | | | |
Bootes | | | |
Hydra | | | |
2. We supplied the Distance to Virgo galaxy cluster
in the above Table. Under the assumption that all
galaxies have the same diameter, use the relative sizes of the images
given above to estimate the
distances to the other galaxies by comparing
how large they are in comparson to the size of M87 (the galaxy
shown for the Virgo cluster of galaxies).
Enter your estimates in the above Table.
3. Make a plot of the redshift versus distance
for the 5 galaxy clusters
using redshift as the vertical axis and Distance
for the horizontal axis. This plot forms Hubble's Law.


