Dynamical Tests
Weighing the Universe
There are obvious contributions to the density of the Universe, e.g.,
planets, galaxies, ... , however,
there are also other not so obvious contributions. We need
total mass density = baryons + neutrinos + photons + ...
Using the
above, we define
Omega = Omega(baryons) + Omega(neutrinos) + Omega(photons) + ...
So the issue becomes what are all of these contributions to
Omega?
Before we go on, photons are in there, but why? Aren't photons
massless? And what if neutrinos turn out to be massless? Why are they
there?
- According to Einstein, E = mc2,
and mass and energy
are equivalent. They are just different forms of a single entity
===> mass = Energy / c2
- CMBR ===> density of photons
= 4.7 x 10⁻³⁴ gm per cubic centimeter << than any
reasonable rho(critical)
- The neutrinos are more problematic.
For the Cosmic Neutrino Background Radiation (CNBR)
====> density of neutrinos = 0.3 density of photons
and if neutrinos are massless (like photons) then the
CNBR does not make a large contribution to the density of the Universe.
- What if neutrinos are not massless?
Galactic Masses (Individuals and Groups)
I will discuss galaxies as probes
of the mass of the Universe. In some cases, there will be direct
counting of galaxies, in other cases, the galaxies will be used as
test particles.
Define
Omega(galaxies) = Omega(baryon) + Omega(other?)
We will measure Omega(galaxy) using light and dynamical techniques
Light Method
This is straight-forward. We simply count up
galaxies.
The complication is that we observe primarily the galaxies which are
easy to see.
However, there are also many galaxies which are
hard to see.
These hard to see galaxies are the ones with low surface brightness (which means
that they are very hard to see against the pervasive background of the night sky.
The number of these low surface brightness galaxies is not yet well-established,
however, the
current density distribution of galaxies is interesting.
But anyway, let's press onward under the assumption that we
may be making a factor
of 2 error or so by only considering the bright galaxies in our discussion.
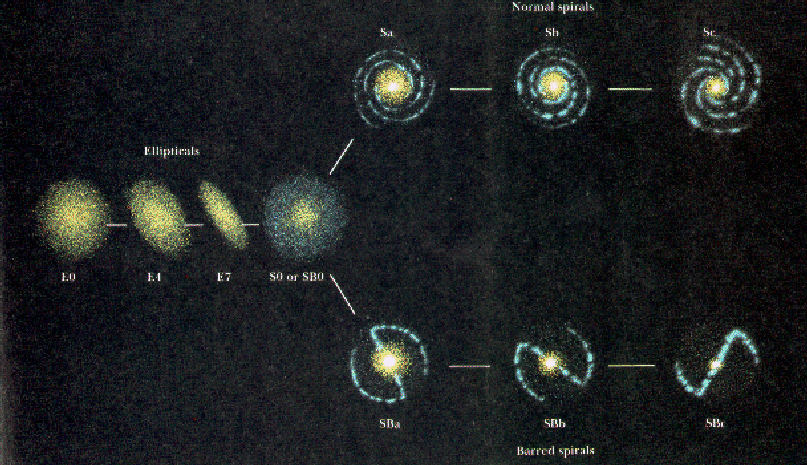
Recall, galaxies are divided up into
different types:

The different types of galaxies have different Mass-to-Light (M/L)
ratios. To get a feel
for what M/L tells us, consider:
- A galaxy made of 1011 stars like the Sun. We then have
M/L = 1011 M(Sun) / 1011 L(Sun)
===> M/L = 1 M(Sun)/L(Sun). If we measure M/L in units of solar masses to solar
luminosities, then this galaxy has M/L = 1.
- Suppose that this same galaxy had in addition to its stars, 1011
black holes of mass 1 M(Sun) ===>
M/L = 2 x 10¹¹ M(Sun) / 1011 L(Sun) ===> M/L = 2
- Suppose that we had a galaxy composed of 1011 stars of mass 10 M(Sun) and
104 L(Sun) ===> M/L = 1011 x 10 M(Sun) / [1011
x 104 L(Sun)] ===>
M/L = 0.001
The Mass-to-Light ratio depends on the types of stars that populate galaxies
and how much
unseen matter exists in the galaxies.
The typical M/L for the visible parts of galaxies are:
- Ellipticals: (M/L) ~ 7 - 20
- Spirals: (M/L) ~ 3 - 5
===> Omega(gal,visible) ~ 0.007
(factor of 2 uncertainty) << 1
Dynamical Methods
The dynamical methods are indirect in the sense that you do not
count-up things. You rely on Newton's laws of physics and
gravity. The dynamical methods are applied on all scales -- from individual
galaxies to pairs of galaxies to clusters of galaxies to clusters of clusters of
galaxies to ... .
GALAXY ROTATION CURVES (1970's)
Consider individual disk galaxies. Recall the discussion of the
Tully-Fisher method. We imagine the stars and the gas in the disks of spiral
galaxies are in orbit about the centers of the disk. In this case, we have
that
M(galaxy) = Rv2/G
So, if we say, pick out a star and then
measure how far it is from the center of the
galaxy and how fast it is moving ===> mass contained within the
orbit of the star
(if the mass of the galaxy is distributed spherically). This is a
powerful method,
for example,
This is a nice way to measure the masses of galaxies. However, let's look at
the
rotation curves of some other galaxies. The curves are
flat at large radii.
Based upon rotation curves, one concludes that the dark matter in the
halos contributes at least 3 - 10 times the mass density of the luminous
parts of the galaxies ===> Omega > 0.02 --> 0.07
BINARY GALAXIES
For two galaxies in orbit,
M/L ~ 90 with an error of 40. Results aren't too good, but we
note that M/L is still >> the M/L for the luminous parts of galaxies.
CLUSTERS OF GALAXIES (1930s)

For one galaxy (roughly speaking),
its motion is like orbital motion and we can infer the mass of the
entire cluster of galaxies. Result:
M(total) ~ v2 {average R} / G
===> Omega(cluster) ~ 0.1 - 0.3
Peculiar Motions
The techinques about which I've talked, lead to Omega < 1.
LENGTH SCALES
The Cosmological Principle says that the Universe is homogeneous and
isotropic on some appropriately large length scale. This means
that if we divide the Universe
into large boxes and then mix up (smooth) the contents of the
boxes, the set of smeared out chunks of the Universe
will make a smooth Universe which appears homogeneous and isotropic to
all observers
in the Universe.
It is apparent that on small scales the Universe is not isotropic and
homogeneous, e.g., the Solar System is clearly lumpy. Thus, the question is
On what scale does the Universe become smooth?, because it
is on this scale and larger that we
measure the average density of the Universe.
So far all of the measurements of the mass (density)
of the Universe have relied
on galaxies. Our measurements
are thus local in that we measure
the mass of the Universe where we can easily see mass. What are the
consequences of this procedure?
- Galaxies: M ~ 1011 M(Sun) and R ~ 50,000 light years
===> rho(gal) ~ 4 x 10-25 gm per cubic centimeter >>
rho(crit)
Does this mean that the Universe is closed? No. The galaxy is a very
overdense region of the Universe and we need to average over a larger
box. The Milky Way resides in the Local Group
where the large galaxies are separated by around
10 million light years. What is the density of
material when smeared out over this larger volume?
rho(Local Group) ~ 5 x 10-32 gm per c.c. << rho(crit) as claimed!
The problem is, is the space between galaxies really empty?
- Clusters of Galaxies: M ~ 1015 M(Sun) and R ~ 10 Mly
===> rho(cluster) ~ 6 x 10-28 >> rho(crit), and clusters of galaxies
are still not large enough to make us feel confident that we are measuring
the average mass of the Universe.
clusters are separated by ~ 30 Mly (or so)
===> rho(cluster of cluster) ~ 2 x 10-29 on the order of rho(crit).
If we start measuring the mass of the Universe
on length scales on the order
of clusters of clusters of galaxies or greater,
then maybe we can start to feel fairly confident
that we are actually measuring the average mass of the Universe and not
simply the mass of the overdense parts.
MASS ESTIMATES BASED ON LARGE LENGTH SCALE ESTIMATES

| Peculiar Velocities
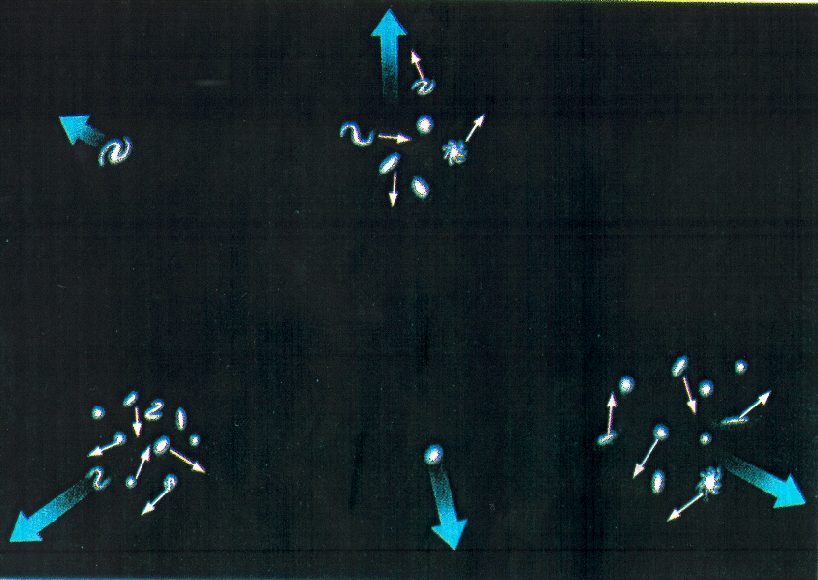
The overall Universe participates in the expansion, the Hubble flow, shown
in the right panel. However,
superimposed on the uniform expansion are smaller scale motions due
to interactions between galaxies, clusters of galaxies, .... .
These motions are referred to as peculiar velocities, streaming motions,
... . This is shown as the internal motions of the galaxies in the figure.
|
The significance of the peculiar velocities
is that in order
for them to have persisted over the lifetime of the Universe, they
must be driven by something. If they were not being driven
then they would have decayed away. The simplest explanation is that
there are mass concentrations in the Universe which causes
material to move around. For example, consider the

|
Anisotropy in the CMBR
Anisotropy is naturally interpreted as due to a peculiar velocity
of the Milky Way galaxy. The motion has a speed of 600 kilometers per
second in the direction of the Hydra-Centaurus supercluster on the sky.
Further (controversial) work showed that the Hydra-Centaurus cluster was
also moving in the same direction at 800 kilometers per second and that
more distant objects were actually approaching the same point.
How did they know this? Well, consider the following
Hubble plot. At d < D, the galaxies appear to
have higher velocities than the Hubble relation. For d > D, the galaxies
appear to have lower velocities than suggested by the Hubble relation.
How can we interpret this result? Well, imagine that there is a
large mass concentration at D (the so-called, Great Attractor).
This mass will then pull nearby objects toward it. So, things with d <
D, will have enhanced velocities and objects with d > D will have
decreased velocities compared to their Hubble flow values. More recent
results have, however, shown that although we are pulled toward the
Great Attractor, we, as well as the Great Attractor are also
pulled toward the Shapley Supercluster. Our peculiar motion is thus driven
by both the Great Attractor and the Shapley supercluster. This more
recent result suggested that the Great Attractor's mass was less than
originally estimated.
Results: G.A. at 130 Mly and M(GA) ~ 1016 M(Sun).
|
Estimates of Omega from Peculiar Velocities
The peculiar velocities are due to mass concentrations which pull on
things causing deviations from the Hubble flow. It is clear that the
size of the perturbation (the size of the peculiar velocities) will
depend upon how much mass pulls on the object. Detailed studies
suggests Omega ~ 1.
 |
Gravitational Lenses
Due to the
curvature of space caused by concentrations of mass,
light-rays bend as they pass by stars, galaxies, cluster of
galaxies, ... .
The bending
makes masses act like
lenses.
A recent release from the HST of a
lens produced by
Abell 2218.
The amount of bend is determined by the mass of the lensing
object.
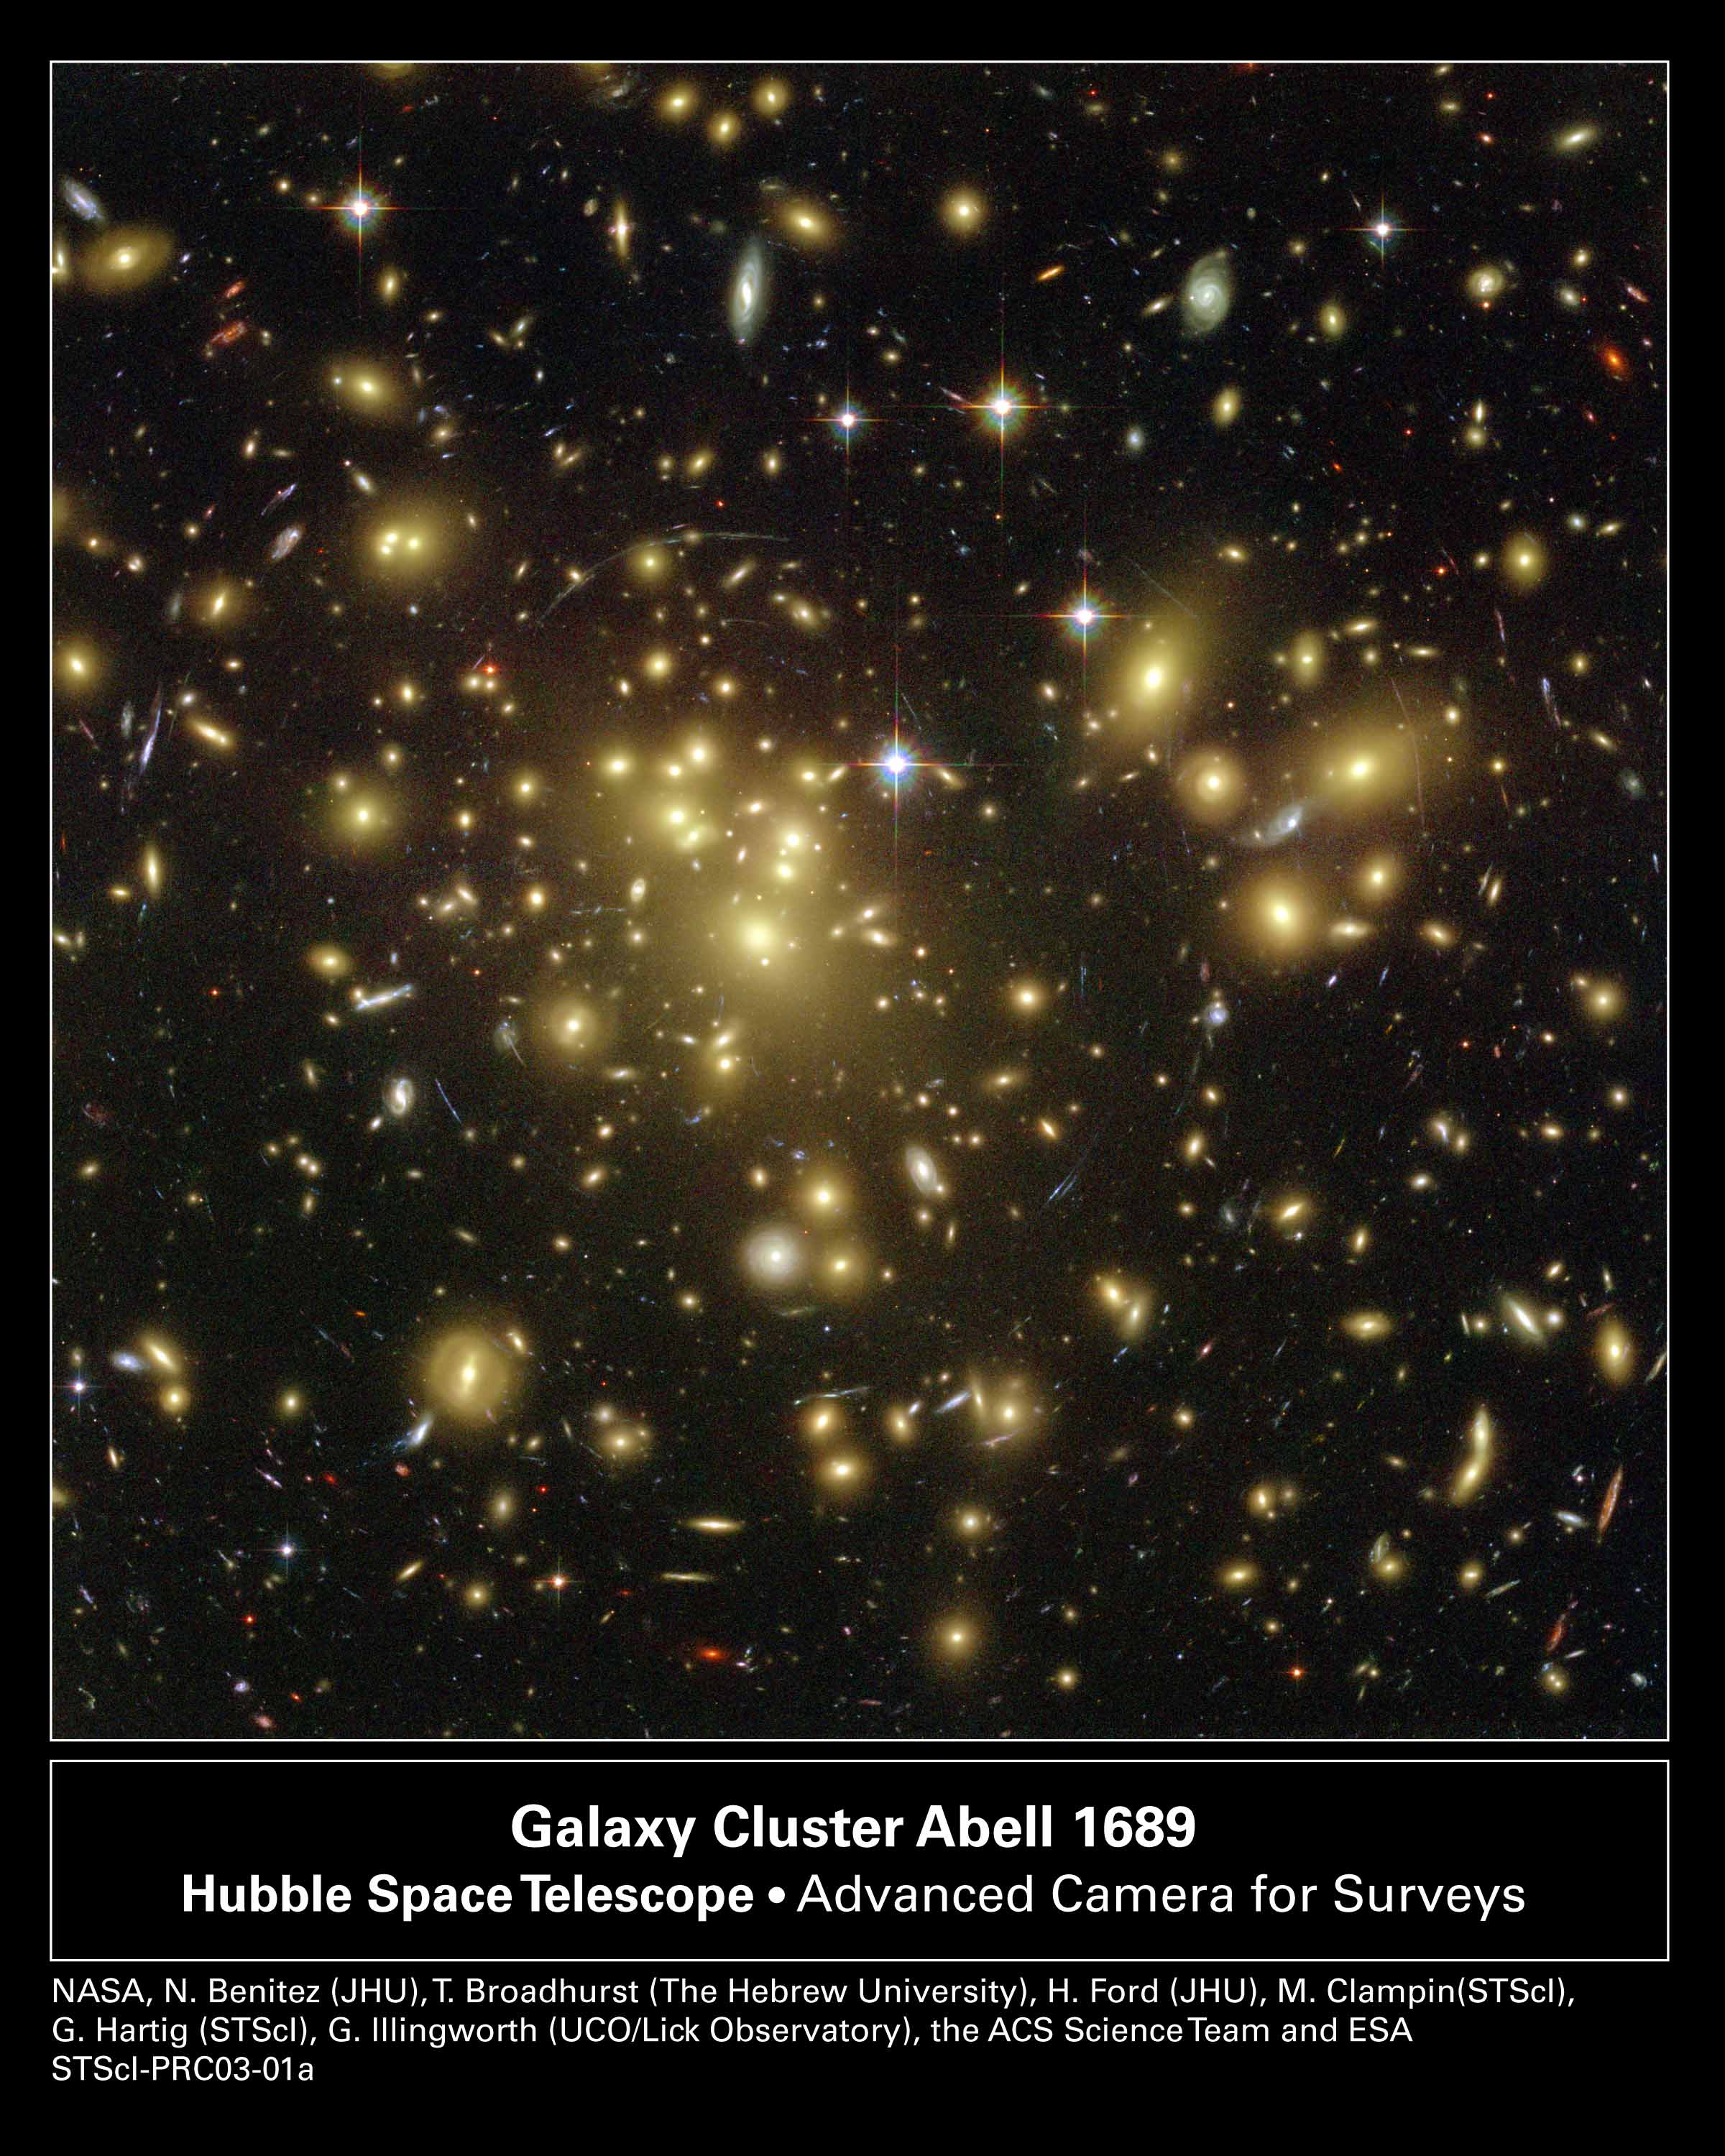
Abell 1689 (shown to the left), lenses background objects. The HST's
Advanced Camera for Surveys found that Abell 1689 lenses 34 different
background objects. Redshifts provide
distances for 24 of the objects.
Using a model for Abell 1689, researchers matched the pictures to
predictions made by models for the Universe that included our best guesses
for how things work (see WMAP analysis of the CMBR).
Assuming a flat Universe and cold, dark matter, the researchers
found Omega about 0.3 and the cosmological constant about 1 with
somewhat large uncertainties. They found
at a 99 % confidence level, that the matter density is between 0.23 and
0.33, consistent with the WMAP results.
|
Return to the Expansion of the Universe


