|
|
Introduction
The Hubble Law is one of the fundamental pieces of observational evidence upon which the modern cosmological theory, the Big Bang Theory, is based. Here, we see how Hubble and Slipher first found the Hubble Law.
1. The first step is the determination of the redshift of a set of galaxies.
|
|
|
Get the redshifts for the following galaxy clusters using the spectrum of the representative galaxy shown for each cluster,
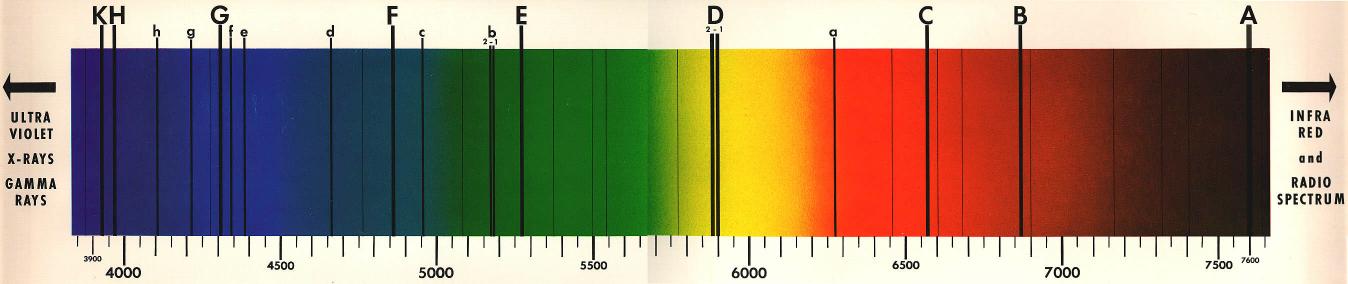
For the spectra shown above, note the following:
The redshift of a galaxy is defined as the relative change in the wavelength of a spectral line of a given element. That is, we compare the difference in the observed wavelength of a line and the rest wavelength of the line to rest wavelength of the line. The redshift z is then formally given by

For the rest wavelength, use the average of the Calcium II K and H lines, 0.3951 microns.
Galaxy Cluster | Change in K and H wavelength | Redshift |
|
Virgo | 59,000,000 ly or 18,000,000 pc | ||
Ursa Major | |||
Corona Borealis | |||
Bootes | |||
Hydra |
2. We supplied the Distance to Virgo galaxy cluster in the above Table. Under the assumption that all galaxies have the same diameter, use the relative sizes of the images given above to estimate the distances to the other galaxies by comparing how large they are in comparson to the size of M87 (the galaxy shown for the Virgo cluster of galaxies). Enter your estimates in the above Table.
How good is your assumption that galaxies have the same diameter? Scan the web and find typical sizes of typical galaxies. Based on your search, estimate how accurate are the distance estimates for the galaxies given in your table.
3. Make a plot of the redshift (actually plot cz, where c is the speed of light) versus distance for the 5 galaxy clusters using cz as the vertical axis and Distance, D, for the horizontal axis. This plot forms Hubble's Law.

4. The Hubble relation is cz = HoD, where the Hubble constant Ho is the slope of the Hubble relation. Based on your plot, what is the value of the Hubble constant? Estimate the uncertainty in your measurement of the Hubble constant. What are your sources of error?
5. Check sites (reputable sites) on the net for the current best value for the Hubble constant, Ho. What is the source for the current best value for the Hubble constant, Ho? How recent is the measurement?
6. State a question that occured to you from the first two weeks of classes.
