This page contains the data gathered for the two hypotheses which we posed for our studies of the Watzek House. It includes the charts, graphs, and diagrammatic drawings of the various locations where we collected data. There will also be a section, along with each graph, which analyzes the data. Following the links from the analysis to the conclusions and recommendation sections of this case study, the viewer will find our recommended solutions to the problems discovered in our examination of the building. As described in the previous pages, the data will address the hypotheses which pose questions about the effect of unexcavated crawl spaces, and unsealed double glazing on thermal comfort in the Watzek House. The third hypothesis is about a possible future study of the cross ventilation strategies which were intended to passively cool one of the bedrooms. This hypothesis will be answered only through the use of rule of thumb calculations and analysis of design strategies.
|
|
|
|
|
|
|
|
|
|
|
|
Crawlspaces
Hypothesis: The absence or presence of the crawlspaces doesn't affect thermal comfort.
The data recorded for the crawlspace study has two parts to its analysis. The first part looks at the direct impact of the crawlspaces on the surface temperatures of the floors. The second part of the analysis examines the affects of the unexcavated crawlspaces on the ambient air temperature of the three rooms we measured. After looking at the ambient air temperatures, which were taken at two locations in each room (as discussed in the section above on methodology), the data will be input into the ASHRAE formula for determining the Mean Radiant Temperature or MRT. This will be done in the Conclusion section to determine how the dining, library, and living rooms of Watzek House perform according to modern standards of comfort.
|
|
|
|
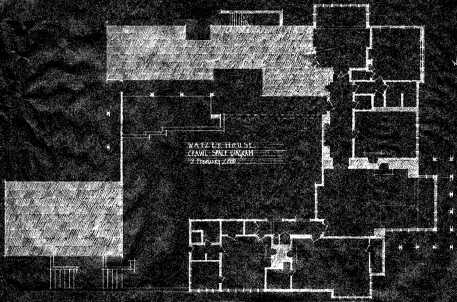
The floor plan above shows the areas of the dining room (upper colored zone), library (middle colored zone), and living room (lower colored zone), which were measured for surface temperatures. By clicking on each respective room, detailed images of the surface temperatures can be seen.
 |
|
|
|
|
Globe temperatures were recorded over the course of several days, from February 5 to February 11, 2000. This data was recorded at two different locations in the rooms, as noted in the section on Methodology. From this data two different graphs have been developed for each room - one which looks at the data for the whole period, and one which examines a single day in detail. The clickable image map above leads to those graphs.
 |
|
|
|
|
|
 |