- 4-Channel HOBO Dataloggers - logging globe temperature, air temperature, relative humidity
- HOBO XT Temperature Logger - logging air temperature
- Raytek - Noncontact Temperature Measurement Device - measuring surface temperatures
- Laptop Computer - launching and reading dataloggers
- Solomat Anemometer - measuring air movement
- Tape measures - establishing locations
- Globe Temperature Device - ping pong balls, finished matte gray for reading globe temperature
- Tripods - suspension of dataloggers at user height
- Scaled Floor Plans - establishing location of dataloggers and temperature readings
- Cameras (digital, 35mm) - recording area of study and methodology
- Coffee - investigator attention stimulation
The 4-Channel HOBO and HOBO XT Temperature dataloggers will be used to measure dry bulb (ambient) air temperature, globe temperature and relative humidity. In order for the dataloggers to record globe temperature they will be adapted by inserting the thermistor into a matte gray ping-pong ball. The HOBOs will be launched with an interval setting of approximately five minutes. This interval was chosen in order to avoid missing dramatic changes in conditions, as well as conserving HOBO memory which will allow us to run the tests for several days. By recording data over the course of several days, we can properly understand the affects of the temperature outside the house on the internal conditions.
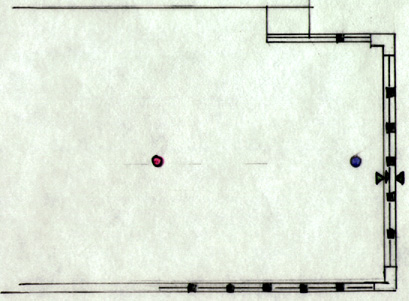
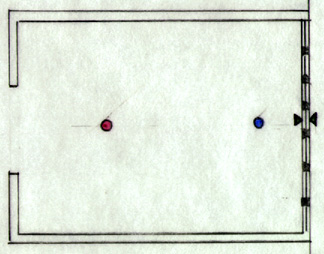
Two dataloggers, fitted with ping-pong balls for reading globe temperatures, will placed in each of the following rooms: Dining Room; Library; Living Room.
One datalogger will be located close to the windows (over the crawl space); the other datalogger will be located in such a manner so that each of the dataloggers will be reading temperatures of approximately the same radius. The exact locations can be seen on the floor plan diagram below. We will use the globe temperature, ambient air temperature, and relative humidity, for calculating the Mean Radiant Temperature (MRT) for the two locations in each room.
In addition to the globe temperature, ambient air temperature, and relative humidity data provided by the dataloggers, air velocity measurements will be taken using the anemometer and used in the MRT equation.
Surface temperatures of the floors will be taken with the Raytek gun. These temperature readings will be taken on a closely spaced grid (1'–0" squares), and will be used to evaluate the actual temperature of the floors in the rooms listed above.