![]()
We have already noted that heat energy is transferred to the oceans near the equator via sunlight. On the average, sunlight near the equator has a greater intensity per unit area than it does near the poles of the Earth.


This is an example of a negative feedback loop, where the outcome of linked processes (sunlight->evaporation->clouds) serves to dimish an earlier stage of the process (sunlight). Negative feedback loops are a form of self-regulation, where the rates (change over time) of a group of linked processes tends to stay near equilibrium values and don't vary wildly over time.
An example of a postive feedback loop is the formation of photochemical smog-- a mixture of sunlight, NO2 and hydrocarbons from automobiles-- during temperature inversions.
The Earth's atmosphere
The Earth's atmosphere comprises the troposphere, the stratosphere and the ionosphere. Because the weight of overlying gases pushes down on those below, 50% of the atmosphere (by mass) can be found in the troposphere. Convection occurs in the troposhere, driven by heat energy transfered from the Sun.
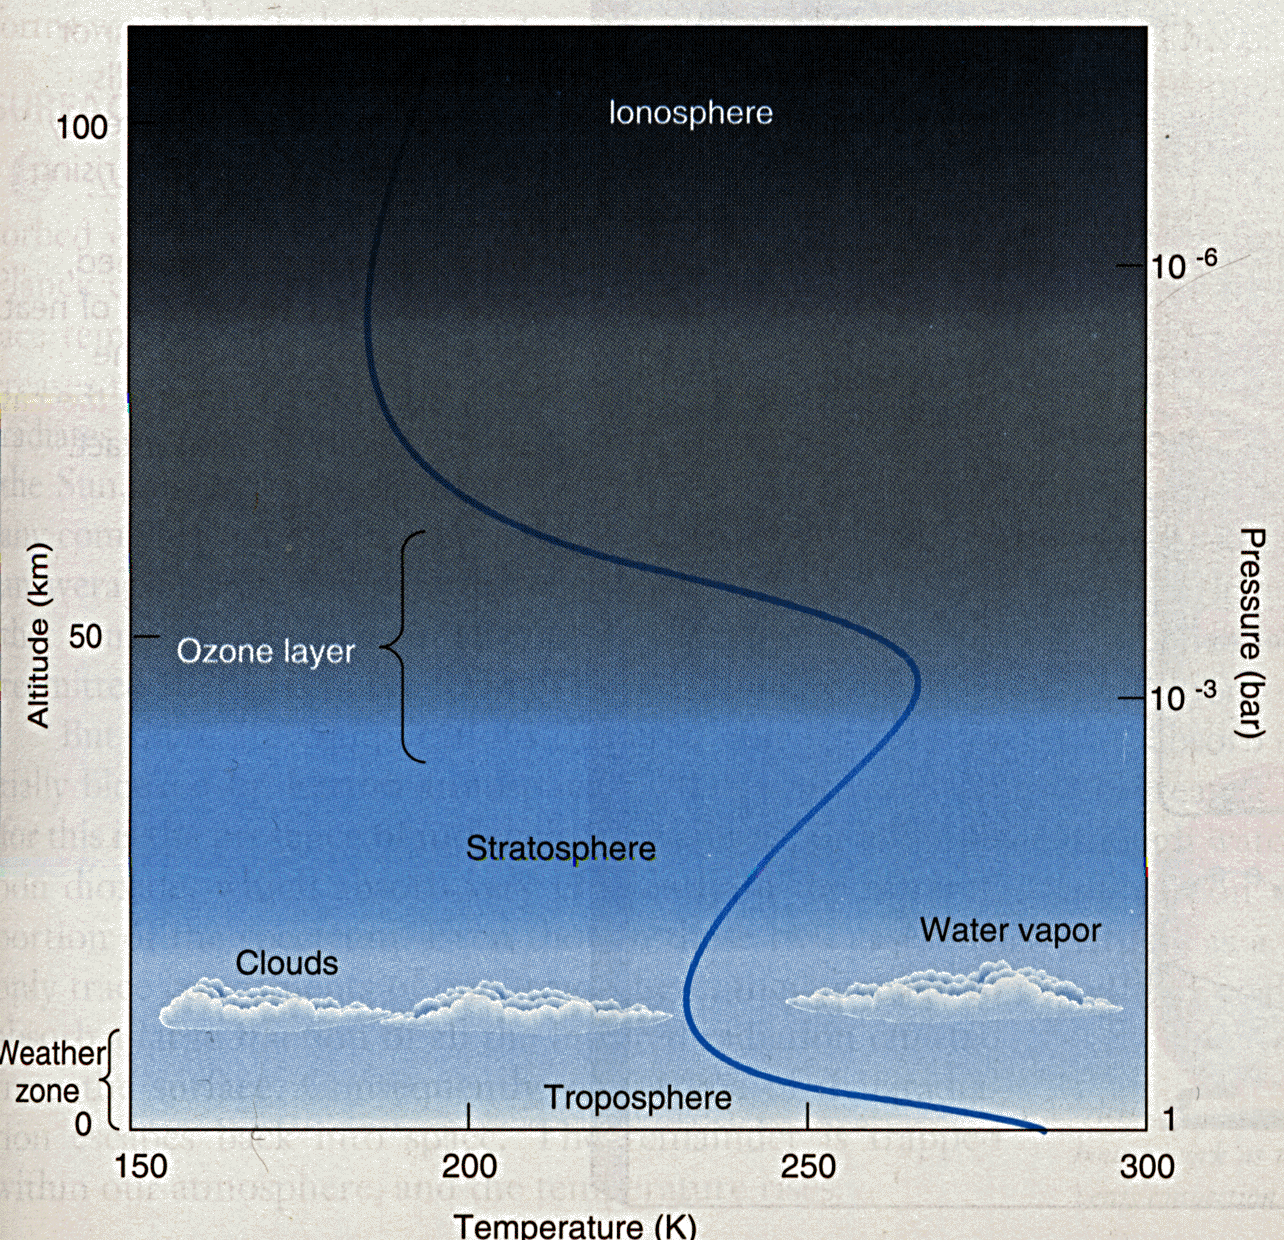
(Source: Astronomy Today, Second Edition by Chaisson and McMillan)
The stratosphere is where jet planes fly. The air is much thinner there, hence there is less air resistance.
The ionosphere is where a significant percentage of the atmosphere is ionized. Ergo, the ionosphere conducts electricity. This has all sorts of implications for us.
Temperature Structure of the Atmosphere
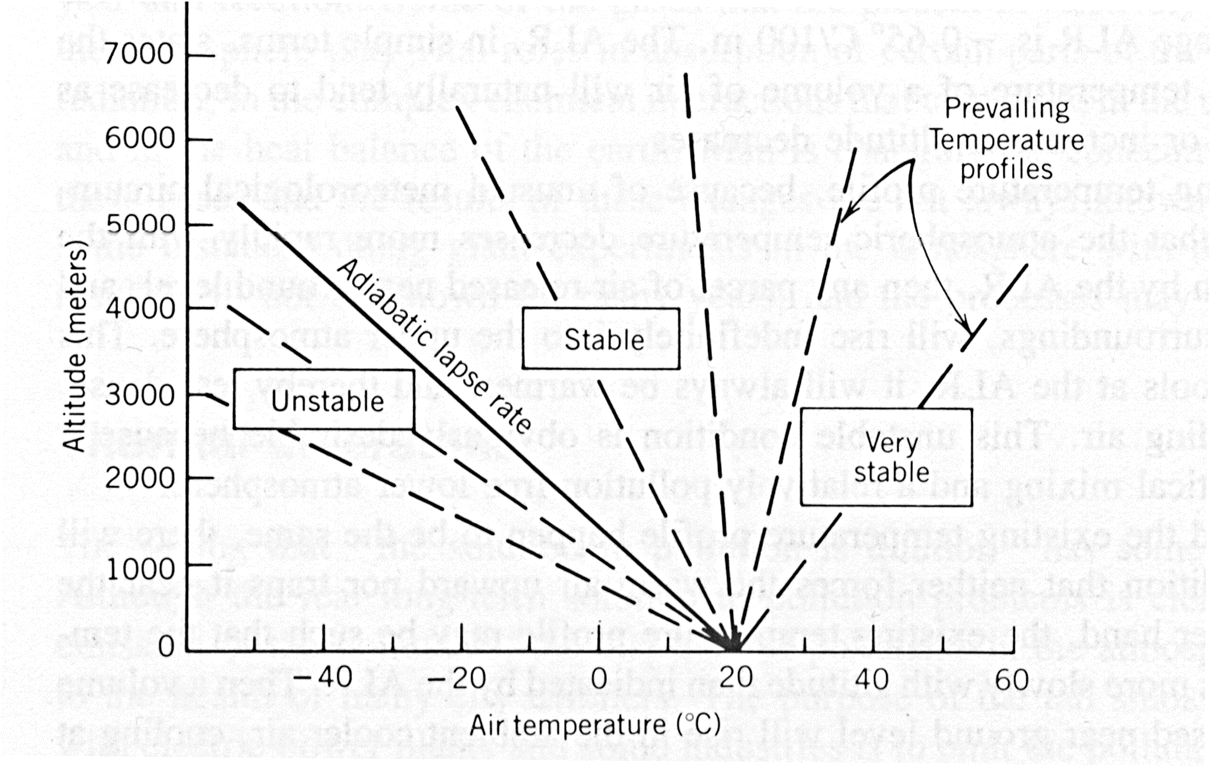
The temperature of the troposphere normally decreases with altitude.
(source: Energy and Problems of a Technical Society by Kraushaar and Ristinen)
Under normal daytime conditions the ground and buildings heat up faster than the air. Cooler air from the upper atmosphere sinks down and displaces the ground-warmed air, dissipating any pollutants entering the air near the ground.
Thermal Inversions
A temperature inversion happens when the air temperature increases with altitude. Then air warmed by the ground, etc., is trapped below cold air just above it. This condition also trapped hydrocarbons emitted by automobiles near the ground. The hydrocarbons mix with nitrogen dioxide (NO2) and sunlight to form ozone, one of the principle ingrediants of photochemical smog. The stuff looks and smells dirty!

(source: Energy and Problems of a Technical Society by Kraushaar and Ristinen)
Interestingly, thermal or temperature inversions can form when masses of dense air drops in the atmosphere (high pressure subsidence), causing it to heat up. Part of the atmosphere then sees and increase in temperature with altitude (right-hand curve, above), and that air mass traps air below it.
Smog and the Positive Feedback Loop
Under "normal" conditions air heated near the ground would eventually break through the upper, colder layer, and cause vertical mixing, breaking up the inversion. Because sunlight is reflected from thick smog, however, the lowermost air actually stays cooler, and doesn't break up the temperature inversion. This is a "positive" feedback loop, though I doubt that residents of Los Angeles or Albuquerque think of it this way!
![]()
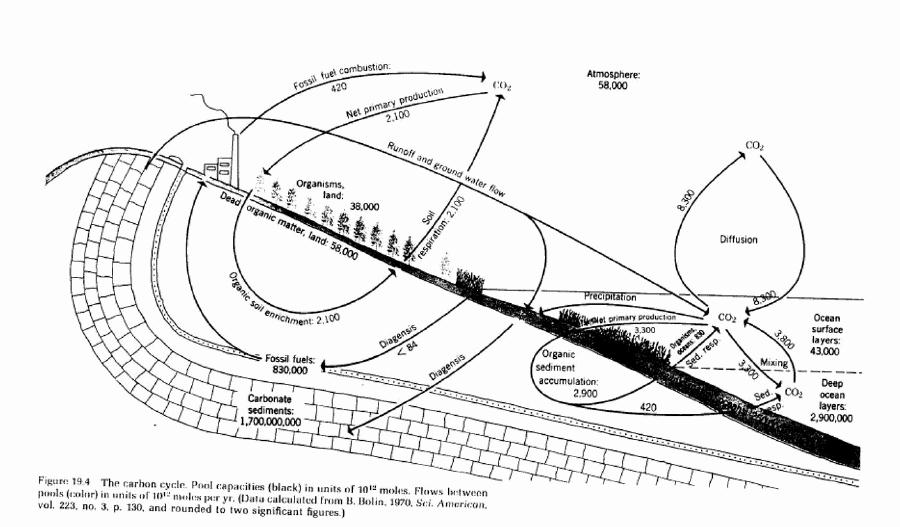
A cycle is just a series of linked processes, for example, the carbon cycle.
Another important attribute of cycles is that the linked processes repeat over time. A good example of a repeating cycle is the Southern Oscillation.
{Excerpted from The Canadian El Niño Bulletin} "For hundreds of years (the first available record dates 1567), South American fishermen have noticed the appearance of warm waters in the eastern Pacific Ocean along the coast of Ecuador and Peru. As the phenomenon typically becomes apparent around Christmas, the name "El Niño," or the Christ Child was eventually bestowed.
At the turn of this century, a connection between El Niño and other weather patterns had yet to be established. During the 1920s, the head of the Indian Meteorological Service, Sir Gilbert Walker, recognized patterns to the rainfall in South America. His discovery lead him to theorize additional associations with the change in the ocean temperatures, and with atmospheric pressure changes measured at stations on both sides of the Pacific (Tahiti and Darwin, Australia).
Noticing that as pressure rises in the east, there is typically an accompanying decrease in the west, with the reverse also true, he coined the term Southern Oscillation to categorize his find."
During normal years trade winds blow from east to west across the Pacific Ocean. Warm surface water is pushed westward towards southeast Asia, Indonesia and Australia, piling up so that sea level is about 1/2 meter higher in western Pacific.
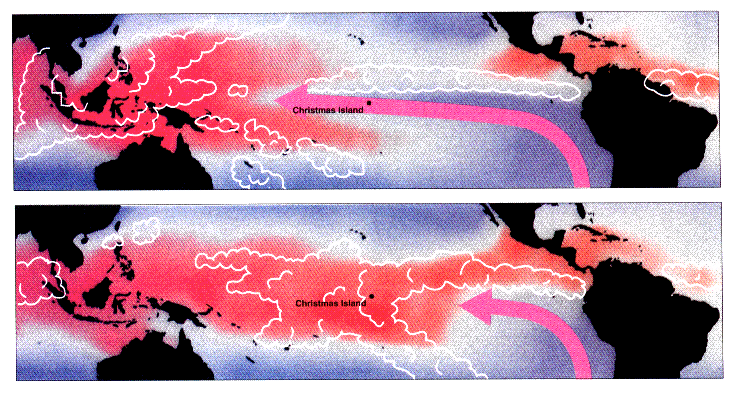
{excerpted from NOAA/PMEL Report to the Nation on Climate Prediction: El Niño and our Changing Climate} "Sir Gilbert Walker provided an important clue concerning El Nino when he discovered that air pressures at sea level in the South Pacific seesaw back and forth between two distinct patterns {That's our cycle....}. In the "high index" phase of what Walker referred to as the "Southern Oscillation" (upper map for November 1988) pressure is higher near and to the east of Tahiti than farther to the west near Darwin. The east-west pressure difference along the equator causes the surface air to flow westward, as indicated by the long arrow. When the atmosphere switches into the "low index" phase (lower map for November 1982) barometers rise in the west and fall in the east, signaling a reduction or even a reversal of the pressure difference between Darwin and Tahiti. The flattening of the seesaw causes the easterly surface winds to weaken and retreat eastward as shown. We now know that the "low index" phase is usually accompanied by El Nino conditions."
Eastern Pacific waters can have temperatures of up to 8 degrees Celsius higher than the cooler surface waters off of tropical, western South and North America. As a result of this normal condition, nutrient-rich waters upwell off the coast of South America, Mexico and southern California, bringing with them food for commercially-important fish and crustaceans.
 THIS IS NORMAL
{source: The Canadian El Niño Bulletin}
The Southern Oscillation is marked by an increase in barometric pressure in the eastern Pacific relative to to the west, as indicated by pressure readings in Tahiti (middle-Pacific) and Darwin, Australia (far western Pacific).
During an El Niño year, the westerly trade winds over the tropical central and eastern Pacific mysteriously abate. Warm surface water in the eastern Pacific is no longer pushed to the west. Cold water can be found at shallower depths off Indonesia and Australia, while warm water remains off the coast of South America.
Commercial fisheries suffer tremendously as they depend on the nutrient-rich cold water for a food source. Climate is also affected, as rain follows the warm surface water to the east. Cloud formation carrying the potential for precipitation moves to the middle Pacific. Seasonally-normal high pressure zones which deflect moist air to the north (including Oregon!) and south are not to be found. Hence storm tracks are not deflected away from California, Mexico, Central America, Bolivia and Peru.
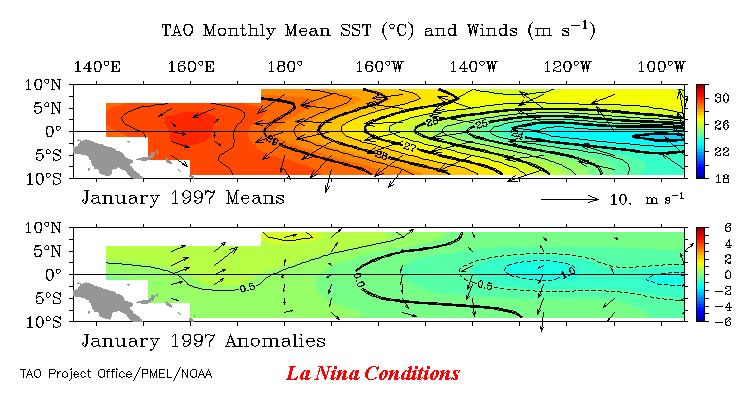
{source: NOAA/PMEL TAO home page}
Recently the U.S. government (NOAA) and other governments have funded an array of buoys intended to record conditions in the tropical Pacific. Called the Tropical Atmosphere Ocean (TAO) array, this network of buoys measures wind speed and direction, atmospheric pressure, air temperature, ocean currents and ocean temperatures among other things.

With this array in place, scientists are able to more precisely map ocean surface temperatures and wind information. The resulting images are startling.
One telling piece of information is the sea surface temperature (SST) as a function of position and month. During normal years one can observe cold water (indicated by greens and blues) upwelling off the northern coast of western South America.


{source: NOAA/PMEL/TAO-- What is an El Niño ?}
During El Niño Southern Oscillation (ENSO) events SSTs in the eastern Pacific are markedly warmer, as indicated by the reds and oranges between 100 and 140 degrees west latitude above.
We don't really understand what causes ENSO events. Further, another opposite phenomenon known as La Niña occurs sporadically as well, typically in years preceding ENSO events {Ha! Since I wrote this, they have decided we are having a La Niña after the last El Niño.} La Niña is characterized by colder than normal surface waters in the eastern Pacific. The effects on climate also appear to be the opposite of those of ENSO. Consequently, California is drier than normal. I suppose that monsoon conditions in east Asia are more pronounced than normal.
It is hard to imagine how the surface waters of the eastern tropical Pacific could heat up during ENSO events without affecting weather conditions around them. But how far does this effect extend? Is the ENSO effect significant relative to the "normal" variation in yearly and monthly weather? Is there some sort of link between the occurrence of ENSO events and global warming? Finally, how does ENSO affect Oregon's weather?
None of these questions have hard and fast answers. Yet that doesn't stop the media from attributing every bad winter storm, every tornado in the southern U.S., and even a balmy winter in Europe to El Niño. Let's examine three questions in greater detail.
To examine how ENSO affects global climate, one must carefully define "global climate" and "ENSO." Although we as spectators of ENSO are more likely to remember the differences between an ENSO event the preceding or following year, characterizing the effect ENSO has on world climate involves averaging the weather of both ENSO events and world climate.
For example, one could take ENSO-year precipitation records for different regions and compare them to an average of precipitation during "normal" (non-ENSO) years for those regions. The difference between average ENSO precipitation versus "normal" precipitation is called the anomalous precipitation. One can also compile similar maps of anomalous temperature-- the difference between average ENSO-year temperatures and "normal" temperatures. Maps of anomalous precipitation and temperature look like this:

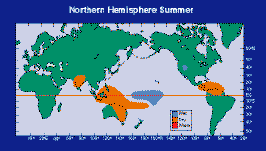
Note that an "average ENSO" event can result in drier than normal regions (orange), wetter than normal regions (blue) and warmer than average regions (red).
The most evident persistent feature of the above images is a ENSO-related dry zone over Indonesia and Australia. Indeed, a 3-March-1997 Oregonian article (see below) notes that Indonesia is now suffering a terrible drought. Note, also, that the Pacific Northwestern region of North America can be characterized as abnormally warm in the winter during ENSO events.
What's missing? California! Note that no abnormal values for precipitation are indicated for California during either the summer or winter of ENSO events. But we have been reading about all those storms hammering California this winter, with houses falling into the ocean, mudslides driving people from entire villages, etc.!
We see no anomalies for California because "normal" California weather encompasses a wide range of monthly-averaged precipitation and temperature to begin with. In other words, sure you can tabulate an average value for precipitation for the month of January for northern California, but for any given January it is also "normal" that the precipitation can vary quite a bit from the average value. Hence, precipitation variations associated with ENSO events fit within the normal variations associated with California.
In three words- "we don't know." Dr. Ed Harrison of PMEL/NOAA points out that, although average global atmospheric temperatures appear to be on the rise, that trend is not obvious for globally-averaged ocean temperatures. ENSO events are thought to be caused by the delayed oscillator theory, which involves interaction between ocean waters and the atmosphere. This excerpt (from Understanding and predicting ENSO, D.S. Battisti and E.S. Sarachik) gives more information about this theory, speaking to the modeling aspects of ENSO origin:
The delayed oscillator mechanism for ENSO incorporates the important observational constraint that the time scale of the basin adjustment is comparable to the time scale associated with the local air-sea interactions. In addition, the delayed oscillator mechanism postulates that the dynamical adjustments in the eastern half of the ocean basin affect the SST (and consequently the atmospheric circulation) vis a vis changing the temperature of the water that is subsequently entrained into the surface mixed layer. Both the Suarez and Schopf [1988] and the Battisti and Hirst [1989] delayed oscillator models were formulated by assuming that the coupled atmosphere/ocean mode was stationary and trapped to the eastern basin.
What is the point of all this? If we don't clearly understand the origins of ENSO events, isn't it a stretch to link ENSO events to "global warming" (of the Earth's atmosphere), another poorly understood phenomenon.
On 3-March, 1998 the Oregonian carried two articles discussing the 1997-98 ENSO's affect on Oregon and California weather (Wetter Forecast Sloshes into Spring, B.T. Meehan, staff writer). This article quoted regional and national weather forecasters predictions that spring would be wetter than average in Oregon AND California, noting that the month of February was abnormally wet for both the LA Basin and the state of Oregon, and 2.5 degrees warmer than average for the latter.
That same article quotes a meteorologist with the National Weather Service's "Climate Prediction Center," who notes that parts of the eastern Pacific have reached 86 degrees F. "That is about as warm as you will ever see the ocean," says the meteorologist. On December 12, 1997, however, an article in the Oregonian noted that the pool of warm water in the eastern Pacific had shrunk by 10% from earlier in the fall. What is the message here?
PMEL/NOAA and CIRES researchers have identified five ENSO-related physical phenomenon that are "robust," meaning that they occur in almost all of the studied ENSO events.
In normal, non-ENSO years strong westerly winds over the eastern Pacific serve to deflect winter storms away from California, Mexico and northwestern South America. For the 1997-98 ENSO this has meant that storms normally destined for the Pacific Northwest have NOT been deflected away from California. This non-deflection of storms, however, is not a robust feature of ENSO events. In other words, we can't say that every ENSO will see big storms in California and relatively drier weather in the Pacific Northwest. What we CAN say, however, is that the Pacific Northwest should be warmer, on the average, during ENSO years.
OK, so now you are El Niño/ENSO experts. Play the movie referenced below, and tell me for which years and seasons an ENSO event occurred.
- Animation of SST/month since 1994.
I have found many good El Niño/ENSO web resources in my travels. Here are two of them that haven't been referenced above:
Occasionally (at least once) asked questions about ENSO
![]()
![]()
![]()
![]()
USA Today Jet Stream Page
![]()
![]()
![]()
![]()

