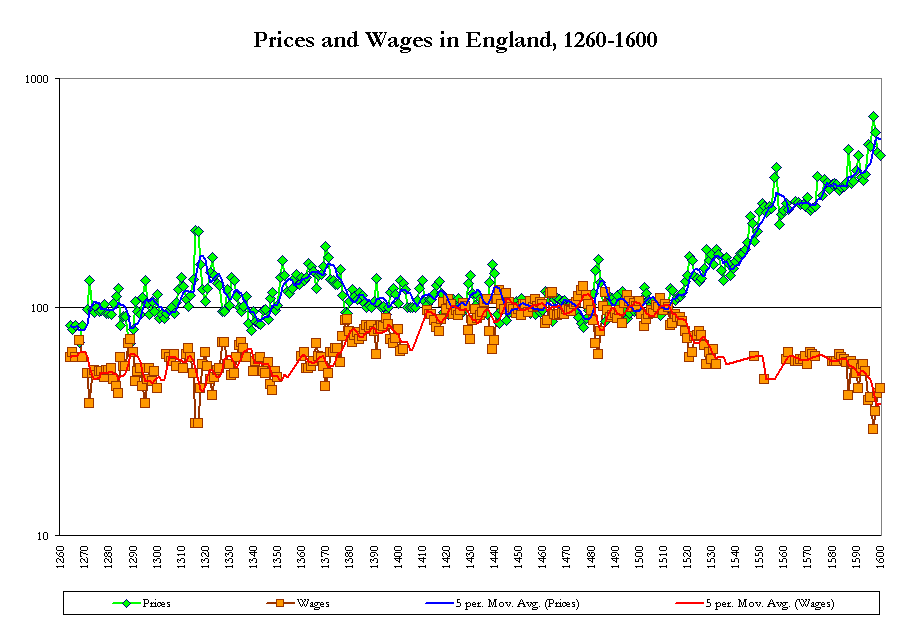
This chart gives an indication of how prices and wages moved in relation to each other during the late medieval and early modern periods. These data were originally compiled during the late 1950s by E.H. Phelps-Brown and S.V. Hopkins. To get an idea of long-term price movements, Phelps-Brown and Hopkins chose a region, southern England, where the records on prices movements were especially rich and continuous, and then determined the average price in a given year of a fixed set (or "basket") of consumable goods. For wages, Phelps-Brown and Hopkins turned to typical wage-rates of building artisans and established how much they would have purchased in those "baskets" of consumable goods. In order to compare the two trends, finally, Phelps-Brown and Hopkins plotted both trends against an index of 100, which corresponded to the prices and wages in 1451 and 1475. The base period 1451-75 was chosen because it lay "within a long period of stability in the trend of prices."
The movement of prices is indicated by the green data points, while wages are indicated in orange. The blue line shows a five-year moving average in prices; the red trend-line shows a five-year moving average in wages. Note also that the scale is logarithmic.

Original data source: E.H.Phelps
Brown & S.V. Hopkins, 'Seven centuries of the prices of consumables, compared
with builders' wage-rates', in E.M. Carus-Wilson (ed.), Essays in Economic
History, vol. 2 (London: Arnold, 1962), pp. 179-96. This chart is based on
data available in the European State Finance Database, "Indexes of prices of consumables
and of builders' wage-rates, 1260-1816." The European
State Finance Database is an international project concerned with the collection
of the sources and data of European Fiscal History and their interpretation, funded
in 1989-90 by the British Academy and in 1990-3 by the Economic and Social Research
Council (Award No. R000231968). ŠESFDB March 1995.
Return to 301 Homepage