Climate Graphs and Cartoons
An open letter to the climate skeptic:
Dear Skeptic (or anyone just plain not sure what to make of this issue),
I think understanding on this issue can only be made by first realizing that there are two main types of questions we are considering in this controversy. The first type are the scientific questions, which must of course be researched, analyzed and debated without political considerations by scientific experts qualified in the relevant areas of investigation (e.g., one doesn’t ask their plumber to provide advice on dentistry). The second type of questions are political, economic and/or social questions, which should be informed by the scientific expert consensus, but ultimately decided by those political, economic or social experts with experience in the relevant areas under consideration with input from the democratic process.
As to the scientific questions there are three primary questions...
Click here to read the rest of the open letter
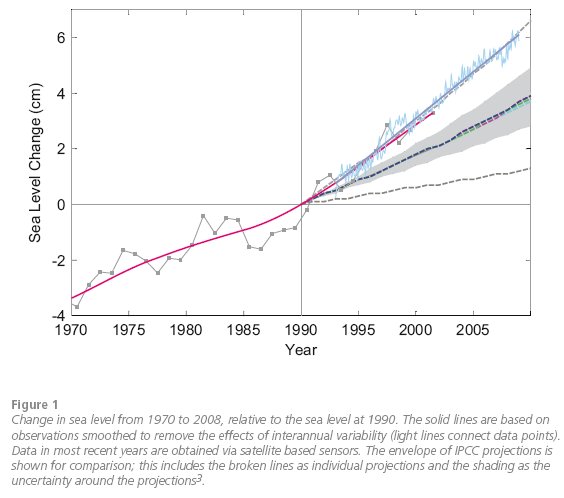
The problem with short term trends of noisy data (Temperature and Sea Level Rise)
From SkepticalScience.com
Climate Graphs
CO2
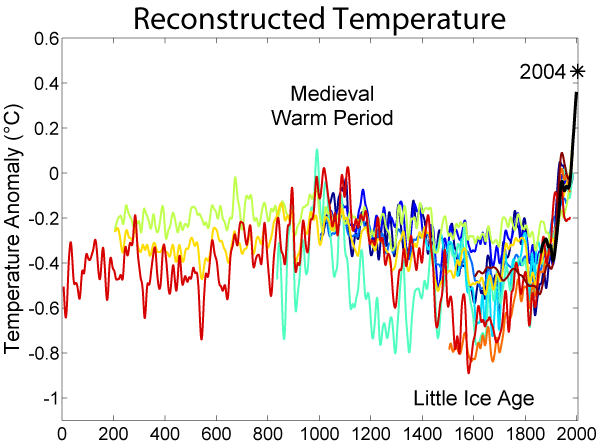
2000 Years of Temperature Reconstruction
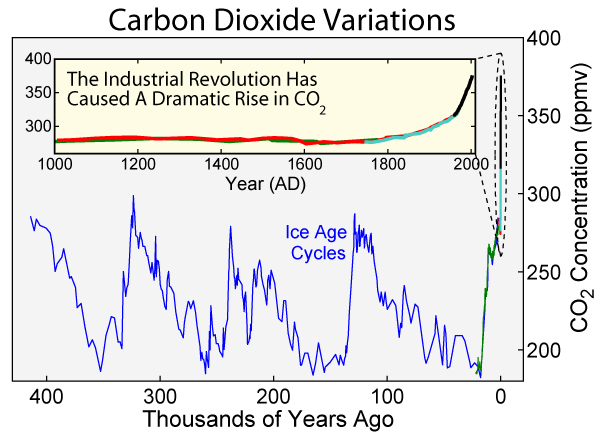
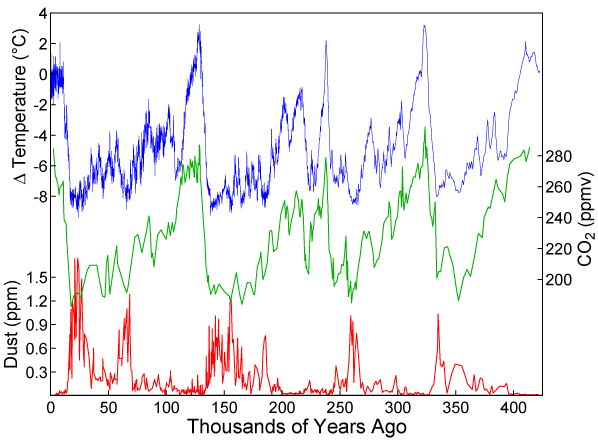
400,000
Years of CO2 Levels (ice core data)
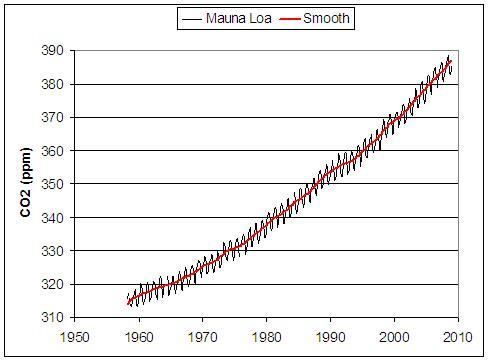
CO2 Mauna Loa Raw
Data
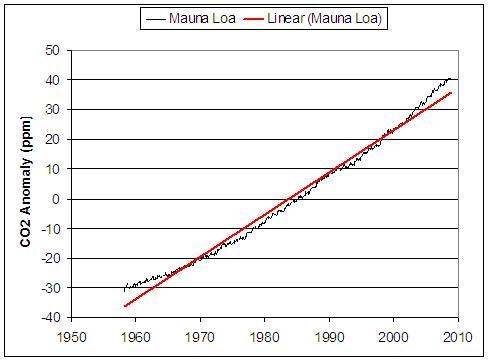
CO2 Level
Acceleration
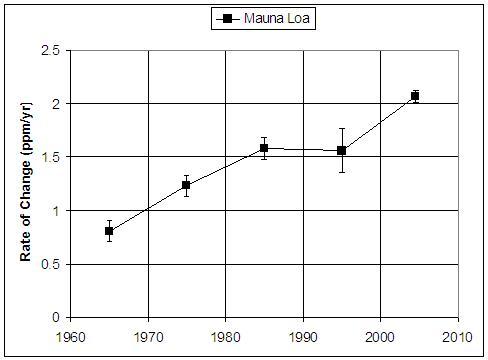
CO2 Rate Of
Increase
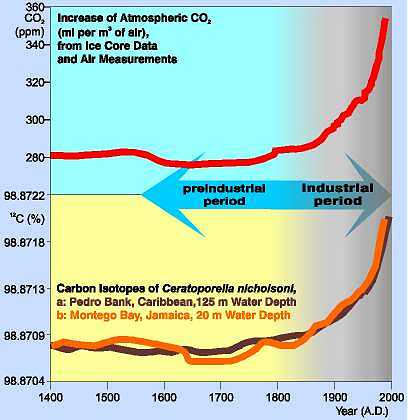
Based on what we know from the radiation forcing properties of greenhouse gases (first developed by Svante Arrhenius (1859-1927 who lived in Sweden and thought this might be a good thing!) and the isotopic compositional changes in the Earth's atmosphere, it is difficult to explain temperature increases over the last 100 years without invoking the effects of anthropogenic CO2.
Temperatures
400,000 Years of Temperature and CO2 (note present day is to left side of graph)
The above graph demonstrates the close correlation between CO2 and temperture over recent geologic time. In these roughly 100,000 year ice age cycles, increased solar insolation (incoming sunlight) due to very slow changes in the Earth's orbit resulted in increases in temperature which in turn allowed additional CO2 to be released from the oceans and permafrost areas, resulting in further temperature increases in a positive feedback loop.
However, today's temperature increases over the last 100 years is due, not to changes in orbital mechanics or solar radiance (which has generally remained steady and actually decreased over the last 30 years), but to unprecedented increases in CO2 mostly from combustion of fossil fuels.
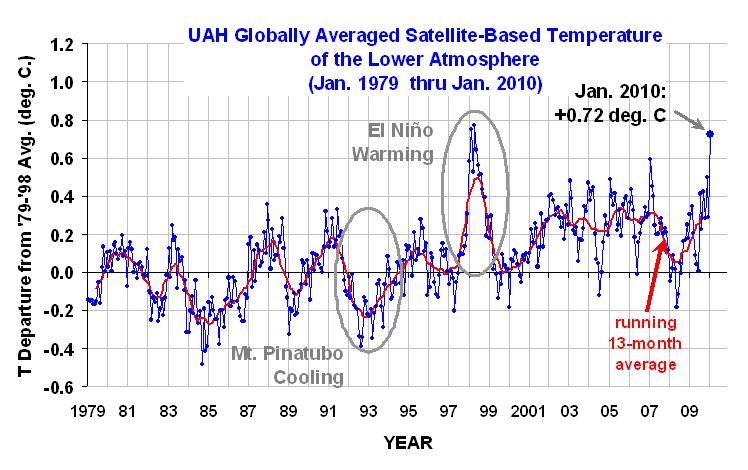
UAH
Satellite Measurements
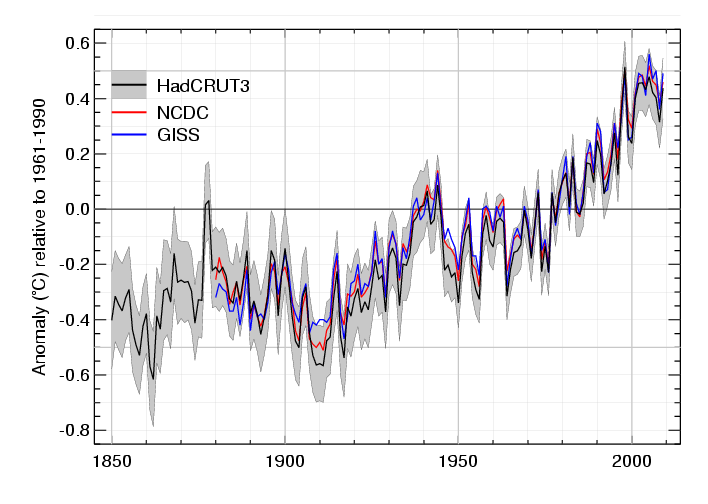
All
Global Temperature Measurements Combined
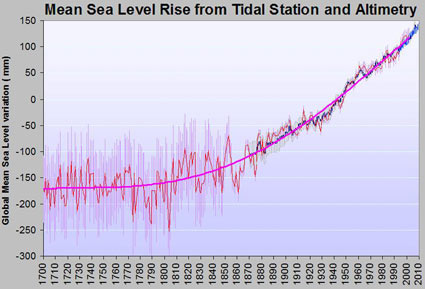
Sea Level Rise
Historical Data (from oldest Dutch recordings) Plus
Recent Measurements
Recent Global Tide
Gauge Measurements Plus Satellite Data
Ice
Sheets Contributing To Sea Level Rise (not including thermal
expansion of oceans)
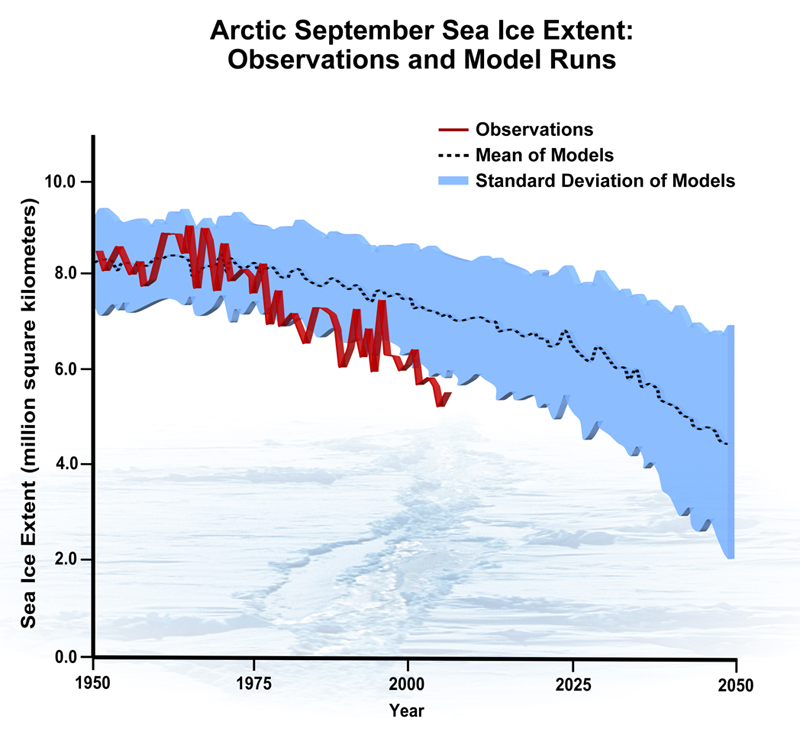
Ice Cap Loss (Arctic)
Recent
Year Ice Extants Compared to Last Century
September
Ice Extent From Satellite Observations
Sea Ice Loss
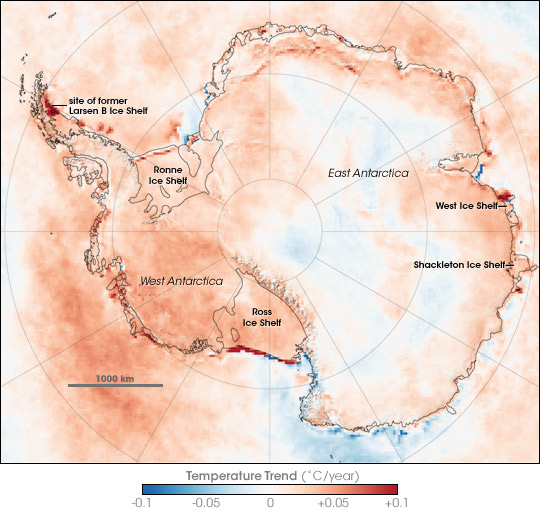
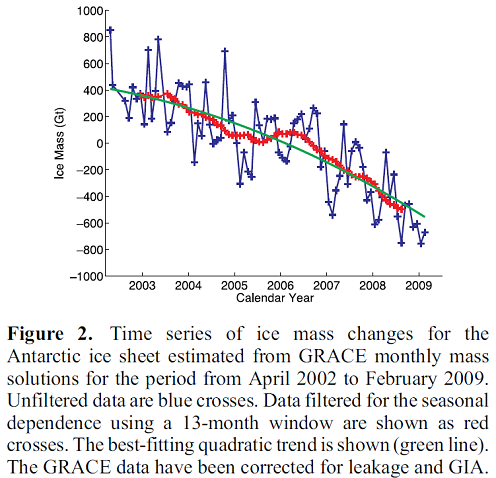
Ice Cap Loss (Antarctic)
Ice Cap
Temperature Trends
Antarctic
Ice Loss
Climate Projections
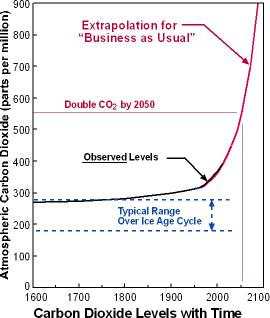
The
Projected Rate of Increase in CO2 (note that more up to date data
shows a doubling before 2050)
Number of
Weeks per Year of 100F or more Days in the US in "most
likely" Projection
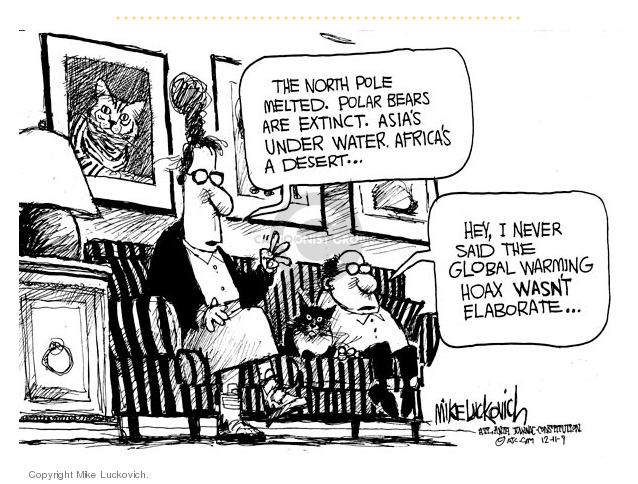
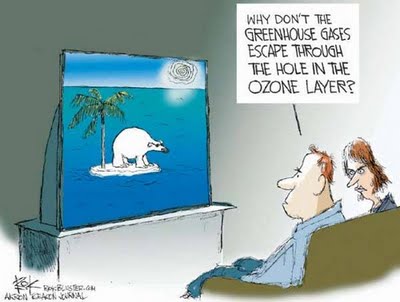
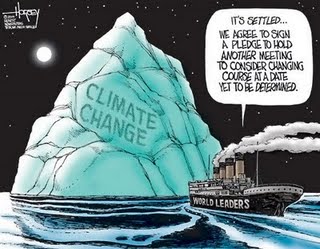
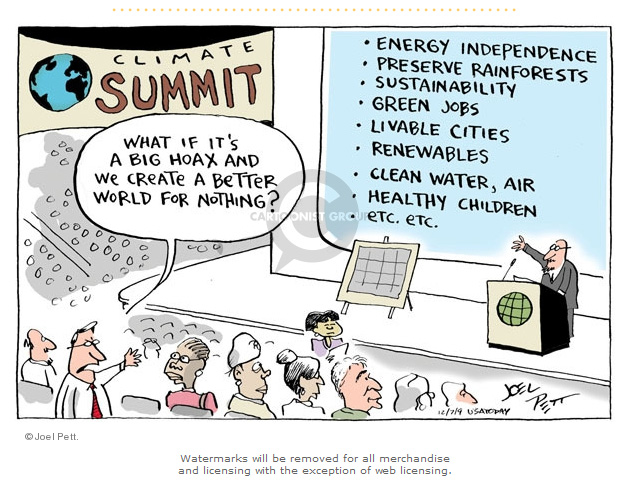
Climate Cartoons
Climate Hoax
Ozone Hole
World Leaders
Emails
What If
Got a question about climate change? I'm a chemist not a climate scientist, but feel free to write me.