|
|
|
|
OBS Operations and Data Quality
|
|
|
|
|
 | The ETOMO seismic array comprised a single deployment of 68, four-component ocean bottom seismometers at 64 sites. All instruments were successfully recovered and both the deployment and recovery operations went exceedingly well. This section contains the following two parts:
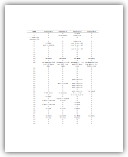
- Data Quality for MGL0910 OBS deployments: summary table and figure
- MATLAB files for Stingray format station file: srStation
The SEGY file formats are described in Appendix A4 and A5 for the SIO and WHOI instruments, respectively.
Maps of the seismic survey are located in Appendix A2: MGL0910 Seismic Survey Summary.
|
|
|
|
|
|
 | OBS deployment and recovery times
|
|
|
|
|
|
| Deployment time averaged 1-1.3 hrs per OBS including transits.
|
|
|
|
|
|
| Recovery time averaged from 12 to 14 OBS in 24 hours.
|
|
|
|
 |
|
|
| Data quality was assessed by making inspection plots of each of the four channels for every instrument for line 25R or sequence 45. The last line to be shot during the survey.
Two site have no usable data, these are OBS 13 and OBS 41. OBS 13 is more unfortunate as it is on the eastern refraction line for crustal thickness. However stations 35 and 36 are very close.
OBS 41 is on the NE corner of the hydrothermal grid and not vital.
|
|
|
|
 |
|
|
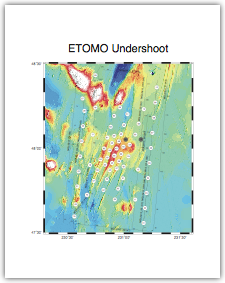
| The OBSs with no usable data are shown as gray circles.
Endv_missingData.pdf
|
|
|
|
|
|
| MATLAB files for Stingray formats:
|
|
|
|
|
|
| I built srGeometry based on the center point and rotation used for planning the outer lines. I overlaid the final shot lines and station locations to check. The figures that this program (make_srGeometry) makes could be a start in figuring out how to define the tomographic grid. STILL TO DO: Use map2xy to plot the true locations on the x-y grid.
I included the functions that this program calls.
|
|
|
|
|