|
|
|
|
Appendix A6: MGL0910 EM122 Multibeam Collection and Processing
|
|
|
|
|
 | The sections of this appendix are as follows:
|
|
|
|
 |
|
|
| Endeavour_prelim_illum.pdf
|
|
|
|
|
|
| Bathymetric data was collected using the R/V Marcus Langseth’s Simrad EM122 12 kHz multibeam echo sounder. Data acquisition commenced on the outbound transit at (46.60°N, 125.55°W) near the base of the continental shelf and ended past the pilot station on the return. Data acquisition continued uninterrupted at all times except for the OBS recoveries when it was turned off at each site to avoid interference with the acoustic release and ranging to the OBSs. In addition to surveying the area of the tomography experiment during OBS deployments, shooting, and the transits between OBSs between recoveries, we spent approximately 2 days at the end of the experiment doing additional surveying to (1) fill gaps in the area of the tomography experiment; (2) recollect data along shooting Line 6 (easternmost shooting line) which was of very poor quality on the first pass due to a poor sea state during the shooting; (3) survey a region around the NEPTUNE Canada Middle Valley Node (48.330°N to 48.537°N and 128.732°W to 128.337°W) and (4) survey a region around the NEPTUNE Canada ODP Hole 1027 node (47.540°N to 47.940°N and 127.988°W to 127.513°W). The survey around the ODP Hole 1027 node was cut short because the ship departed for Astoria.
The EM122 has a maximum swath width of 6 times the water depth but the effective swath width varied from 2 to 6 times the water depth depending on the sea state and the heading. The data was of poorest quality when heading into rough seas. Even in good seas the outermost beams always had significantly more scatter than the inner beams. It was noticed that the scatter of depths on the center beams substantially exceeded that on beams immediately to either side with a tendency for perhaps 20% of the depths to be too large. The problems seems worse in sedimented regions. It leads to pockmarks in the bathymetry if the bad soundings are not edited out – a tedious process. We verified that this effect was not the result of interference from the 12 kHz Knudsen system by turning it off for a short period and comparing the data. The Knudsen system was also turned off during the final two days.
Data was acquired by the EM122 system into 1204 half hour Simrad “.all” files with the filenames ####_YYYYMMDD_HHMMSS_Langseth where “####” is a sequential file name starting with “0000” and ending with “1203”. Files were transferred to a Windows PC borrowed from the UW School of Oceanography’s spatial analysis lab for processing with CARIS HIPS 7.0 using the UW School of Oceanography license.
|
|
|
|
 |
|
|
 C. C. | Processing Performed at Sea
|
|
|
|
|
|
| The CARIS HIPS processing undertaken during the cruise was all done in a single “project” MGL0910_1. Files 0028 to 1166 were processed. Files on the outbound and inbound transits were excluded.
The first step in processing was the definition of a vessel configuration file “langseth.hvf”. Because the EM122 system includes corrections for the relative positions of sensors on the boat, the Heave, Pitch, Roll, Gyro and Navigation sensors were assigned coordinates in meters [X (positive to starboard), Y (positive forward), Z (positive down)] of [0, 0, 0]. The Swath and SVP1 (sound velocity profile) sensors were set to [0.5, 16.068, 8.535] (the correct values for the receiving transceiver), and the Waterline to Z=+1.94 m with the “Apply” field set to “No”. It was noticed that in tests to apply the sound velocity corrections to the transit data that starboard beams were shallower than those on the port. Through trial and error it was found that by including the installation roll (0.1603°) and pitch (-0.0772°) misalignments of the transducers as errors for the Pitch and Roll sensors but with the Apply field set to “No”, the swaths were flattened by the sound velocity correction. Since these corrections should have been applied within the EM122 acquisition system it is not clear why including them in the vessel configuration file makes a difference especially since the Apply field is set to “No”. The validity of doing this needs to be checked with LDEO, Simrad, CARIS and possibly Larry Meyer’s group in New Hampshire. It is also necessary to check that the vertical offsets entered for the Swath, SVP1 and Waterline are correct given the nature of the corrections applied internally by the EM122 (i.e., that there is no DC offset introduced to depths in the processed data).
|
|
|
|
|
|
| The CARIS HIPS processing steps applied during the cruise comprised:
|
|
|
|
|
|
1. | About every 5 days on average, importing the raw Simrad files into day directories using the Import Wizard with default options for Steps 4-6 except that the sidescan data was imported.
|
|
|
|
|
|
2. | Saving a new “session” that included all imported bathymetry up to that date. Session names were for the format MGL0910_1_session#.wrk with # being 1-6 and MGL0910_1_session6.wrk being the final one created.
|
|
|
|
|
|
3. | Applying to the newly imported files a sound velocity correction with a single sound velocity profile in file langseth153-164.svp. This is the mean of the XBT profiles 153-164 after each was extrapolated to 3000 m with a quadratic polynomial (excluding 156 which was bad and 157 which did not extrapolate well). None of the other options were selected in the Sound Velocity Correction dialog box.
|
|
|
|
|
|
4. | Applying to the newly imported files a tidal correction with the Load Tide command using the single file method and the tidal model supplied by Hal Mofjeld in file ‘endeavourtide.tid’.
|
|
|
|
|
|
5. | Applying to the newly imported files the Merge command.
|
|
|
|
|
|
6. | Defining a new field sheet with the spatial limits that were typically 47°20’N to 48°40’N and 129°40’W to 128°30’W. For all but the last set of field sheets the default UTM (WGS94) projection was used. For the final set a Mercator CM180 projection was used to allow exporting to a latitude/longitude GMT-created ‘.grd’ file.
|
|
|
|
|
|
7. | Creating a Swath Angle base surface (weights based on swath angle) with a resolution of 50 m (a resolution of 25 m slowed the PC due to memory limitations).
|
|
|
|
|
|
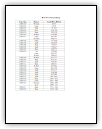
8. | Student editing of the swaths using the Swath editing tool to remove artifacts. Students were assigned days to edit (assignments are listed in Table 1) and were encouraged to eliminate the following:
|
|
|
|
|
|
a | Outer beams when they were inconsistent from ping to ping or isolated portions of the outer beams were there are many missing beams inboard.
|
|
|
|
|
|
b | Bad swaths – the first swath in the file is often bad.
|
|
|
|
|
|
c | Obvious outlying pings.
|
|
|
|
|
|
d | Data compromised by the ship turning quickly.
|
|
|
|
|
|
e | Artifacts particularly troughs in front of steep slopes on outer beams.
|
|
|
|
|
|
9. | Recalculating the base surface and reediting by students as necessary.
The final session MGL0910_1_session6.wrk included all the edited data and 3 Field Projects/Base Surfaces with a Mercator CM180 projection:
Sept22/Endeavour_prelim 47°20’-48°40’N & 129°40’-128°30’W
Sept22_MV/MV_prelim 48°16’-48°36’N & 128°48’-128°12’W
Sept22_1027/1027_prelim 47°32’-47°57’N & 128°06’-127°24’-W
|
|
|
|
|
|
10. | The export wizard was used to create ASCII Latitude/longitude/depth files for the three final Base surfaces. Latitude and longitude were exported in decimal degrees format with 6 decimal places of precision and depths with 2 decimal places. The exported files are:
Endeavour_prelim_XYZ.txt
MV_prelim_XYZ.txt
1027_prelim_XYZ.txt
|
|
|
|
 |
|
|
D. | Generation of Preliminary ‘.grd’ Grid Files and GMT Maps
|
|
|
|
|
|
| To generate ‘.grd’ files and GMT maps the exported ASCII files edited to remove the letters ‘N’ and ‘W’ and saved as:
Endeavour_prelim.xyz
MV_prelim.xyz
1027_prelim.xyz
The Matlab script run_caris2gmt.m calls the function caris2gmt.m which calls GMT commands to create grd files of the exported data and GMT maps of plain and illuminated bathymetry using the script gmtmap.sh
The grd files are:
Endeavour_prelim.grd
MV_prelim.grd
1027_prelim.grd
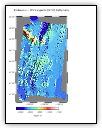
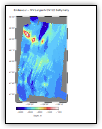
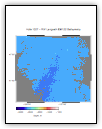
The postscript files (Figures 1-6) are:
Figure 1. Endeavour_prelim.ps
Figure 2. Endeavour_prelim_illum.ps
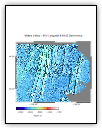
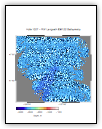
Figure 3. MV_prelim.ps
Figure 4. MV_prelim_illum.ps
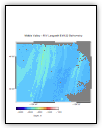
Figure 5. 1027_prelim.ps
Figure 6. 1027_prelim_illum.ps
Note that in the central Endeavour region many areas were mapped by up to >30 distinct swaths which leads to a fuzzy preliminary map because high-uncertainty outer-beams and outlying soundings have not been consistently removed (this can be done by automatic processing in CARIS that has yet to be performed). The data quality is relatively poor for the Middle Valley and ODP Hole 1027 maps because the weather was bad during the mapping. “Washboarding” can be seen in much of the data on the illuminated plots for these regions but it might be possible to remove this using techniques developed by Robert Dunn et al. (Dunn, R. A., D. S. Scheirer, D. W. Forsyth, A detailed comparison of repeated bathymetric surveys along a 300-km-long section of the southern East Pacific Rise, J. Geophys. Res., 106 (B1), 463-472, 2001).
Also note that caris2gmt.m automatically determines the region and grid spacing of the ‘.grd’ file. There is some sort of pixel registration problem that occurs when creating the ‘.grd’ files.
(a) For Middle Valley the Matlab script calculates the grid size as 1285x1019 but xyz2grd creates a grid that is 1284 x 1019.
(b) For the 1027 and Endeavour the grid sizes match but grdimage gives the following warning:
grdimage: GMT WARNING: (w-x_min) must equal (NX + eps) * x_inc), where NX is an integer and |eps| <= 0.0001.
This problem is likely due to a rounding problem but which has not been resolved by simple modifications attempted to date. It should be addressed during post cruise processing.
|
|
|
|
 |
|
|
E. | CARIS Processing not Performed at sea
|
|
|
|
|
|
| CARIS can be used for additional processing at the UW.
|
|
|
|
|
|
1. | Automatic filtering of spikes.
|
|
|
|
|
|
2. | Removal of outer beams in regions of good coverage.
|
|
|
|
|
|
3. | Removal of outlying soundings that exceed a specified multiple of the standard deviation at a particular grid point.
|
|
|
|
|
|
5. | If uncertainty information can be obtained for all the components of the system then it may be feasible to propagate errors through the system to get horizontal and vertical uncertainties for each sounding. This would in turn allow optimal beam weighting in creating surfaces.
|
|
|
|
 |
|
|
F. | Outstanding Questions/Tasks
|
|
|
|
|
|
1. | Verify that the Vessel Configuration file is correct..
|
|
|
|
|
|
| (a) Pitch and Roll errors.
(b) Depths relative to sea surface.
(c) Accounting for different positions of transmitting and receiving transceiver – this appears to be different from the two transceiver option.
|
|
|
|
|
|
2. | Ensure that there are not significant systematic spatial or temporal changes in the water column velocity. Reprocessing based on full suite of XBTs extrapolated to maximum water depth.
|
|
|
|
|
|
3. | Attempt to generate inputs to process with propagated uncertainties. Contact Al Walsh at LDEO; CARIS and Larry Meyer’s group at New Hampshire.
|
|
|
|
|
|
4. | Additional processing at UW as detailed above.
|
|
|
|
|
|
5. | Look into techniques to remove the “washboarding” in the swath data.
|
|
|
|
|
|
6. | Follow up on center beam noise – Can it be removed by automatic processing and can the Langseth’s EM122 system be improved.
|
|
|
|
|
|
7. | Resolve pixel registration problems associated with creating GMT ‘.grd’ files from CARIS.
|
|
|
|
|
|
| RV Langseth Sensor configration is described in Appendix A9: MGL0910 RV Langseth Sensor Configuration and Data Formats
|
|
|
|
|