|
|
|
|
| The srElevation structure stores an elevation map in meters.
Elevation is defined relative to the reference ellipsoid. Z-axis is positive upward; bathymetry is negative. All required variables in srElevation.header are similar to those found in a GMT compatible .grd file (normal node registration). srElevation.data is a 2-D grid (nx, ny) that is not rotated with respect to latitude and longitude. srElevation.data(1,1) is located in the lower left hand corner.
Important Notes:
a) The elevation map must be larger in area than the spatial extent of the area to be image (srModel.u).
b) The elevation map must not have empty or NaN values.
c) A GMT .grd file can be converted to xyz using grd2xyz. The output of grd2xyz is ordered by x then y, with the first node being in the upper left hand corner. This is DIFFERENT from Stingray, which is also ordered by x then y, however, the first point is in the lower left hand corner. An easy way to reformat the output of grd2xyz in Matlab is:
srElevation.data = reshape(xyz(:,3),nx,ny);
srElevation.data = fliplr(srElevation.data);
|
|
|
|
|
|
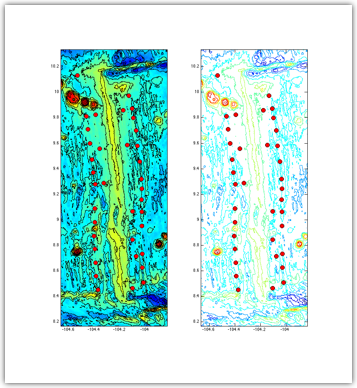
 | Example of Matlab display:
|
|
|
|
|
|
| Geodetic Coordinate System
|
|
|
|
 |
|
|
| srElevation =
header: [-104.67 -103.83 8.1667 10.333 0.00136 0.0013609 614 1593]
data: [614x1593 double]
filename: ‘/Users/drt/Projects/Undershoot/Skew/srInput/srElevation_900.mat’
longitude: [1x614 double]
latitude: [1593x1 double]
LAT: [614x1593 double]
LON: [614x1593 double]
X: [614x1593 double]
Y: [614x1593 double]
|
|
|
|
 |
|
|
| srElevation
srElevation =
header: [451.9 462.4 6516.6 6526.8 0.05 0.05 211 205]
data: [211x205 double]
filename: ‘/Users/drt/Projects/Luno/srInput/srElevation_Luno.mat’
easting: [1x211 double]
northing: [205x1 double]
EASTING: [211x205 double]
NORTHING: [211x205 double]
|
|
|
|
 |
|
|
|
Geographic Coordinate System is geodetic (srGeometry.tf_latlon=true)
srElevation.header
|
srElevation.header(1)
|
decimal degrees
|
x_min
|
srElevation.header(2)
|
decimal degrees
|
x_max
|
srElevation.header(3)
|
decimal degrees
|
y_min
|
srElevation.header(4)
|
decimal degrees
|
y_max
|
srElevation.header(5)
|
decimal degrees
|
x_inc
|
srElevation.header(6)
|
decimal degrees
|
y_inc
|
srElevation.header(7)
|
integer
|
nx
|
srElevation.header(8)
|
integer
|
ny
|
|
srElevation.data
|
2-D array (nx,ny)
|
meters
|
Geographic Coordinate System is geodetic UTM (srGeometry.tf_latlon=false)
srElevation.header
|
srElevation.header(1)
|
kilometers
|
x_min
|
srElevation.header(2)
|
kilometers
|
x_max
|
srElevation.header(3)
|
kilometers
|
y_min
|
srElevation.header(4)
|
kilometers
|
y_max
|
srElevation.header(5)
|
kilometers
|
x_inc
|
srElevation.header(6)
|
kilometers
|
y_inc
|
srElevation.header(7)
|
integer
|
nx
|
srElevation.header(8)
|
integer
|
ny
|
|
srElevation.data
|
2-D array (nx,ny)
|
meters
|
|
|
|
|
 |
|
|
|
srElevation.longitude
|
decimal degrees
|
Longitude of grid points (row vector)
|
srElevation.latitude
|
decimal degrees
|
Latitude of grid points (column vector)
|
srElevation.LON
|
decimal degrees
|
Longitude of grid points (mesh)
|
srElevation.LAT
|
decimal degrees
|
Latitude of grid points (mesh)
|
|
|
|
|
|
|
| Plotting the srElevation Structure
|
|
|
|
|
|
| Stingray/toolbox/plot_srElevation.m
|
|
|
|
|
|
|
srElevation.longitude = linspace(srElevation.header(1), ...
srElevation.header(1)+(srElevation.header(7)-1)*srElevation.header(5),...
srElevation.header(7)); % Row vector
srElevation.latitude = linspace(srElevation.header(3), ...
srElevation.header(3)+(srElevation.header(8)-1)*srElevation.header(6),...
srElevation.header(8))’; % Transpose to be a column vector
|
|
|
|
|
|