Array Indexing: (nx,ny,nz) vs (i,j,k) |
| In order to correctly plot results, it is useful to understand the array indexing of Stingray and Matlab. Below is a discussion of the two. Conventions: Multi-dimensional arrays in Stingray related to either geographic maps or cartesian coordinates have their indices ordered as (nx, ny, nz). Examples include the slowness model, maps and the forward star. Both fortran and matlab use column major ordering. See the following links for discussions: http://en.wikipedia.org/wiki/Row-major_order http://webster.cs.ucr.edu/AoA/Windows/HTML/Arraysa2.html In column major ordering the left-most index of an array A(i, j, k) increments the fastest (i.e., i, then j, then k). Note that the leftmost index is the row-number (i.e., if the row-number increments fastest the index moves down a column first (:,1,1), hence column major ordering). The (row, column) ordering of matlab versus the (nx, ny) ordering of Stingray can cause confusion since the x-values appear in the columns, not the rows, i.e. the up-down direction and not the left-right one. Plotting: Because matlab is column-major, by default it would show pcolor(srModel.u(nx,ny,1)) with the x-values in the up-down direction. One way to remedy this problem is to transpose the matrix. pcolor( srModel.u(:,:,1) ) will plot x-values in the vertical direction pcolor( srModel.u(:,:,1)’ ) will plot x-values in the horizontal direction The following will also work since the LON and LAT positions of u(:,:,1) are explicitly passed, note that the transpose is not used: image(srModel.LON, srModel.LAT, srModel.u(:,:,1)) |
|||||
| Meshgrid and Calculations: meshgrid is useful for making X, Y and Z grids; however, it can be confusing too. |
|||||
| Before using meshgrid, carefully read the notes. When using it to calculate angles between coordinate positions on a mesh, it might be worth reversing the arguments: [Y X] = meshgrid(yg,xg). Alternatively, doing it explicitly in a ‘for’ loop will avoid confusion but will take longer. |
|||||
| Expand the following for a Matlab example: |
|||||
| The following matlab example illustrates column major ordering: >> A=[1:15] A = 1 2 3 4 5 6 7 8 9 10 11 12 13 14 15 >> reshape(A,[3 5]) ans = 1 4 7 10 13 2 5 8 11 14 3 6 9 12 15 In the above example, if A were a map with dimensions (nx = 3, ny = 5), then plotting it would give: >> image(A) >> colormap(jet(15)) >> colorbar 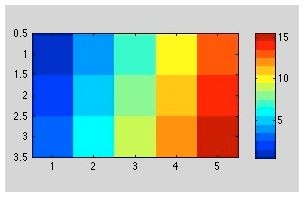 the display of A and the image of A are consistent when viewed as matrices, however, note that if A were a map with (nx=3 and ny=5) that the x-values are plotted in the vertical direction. |
|||||
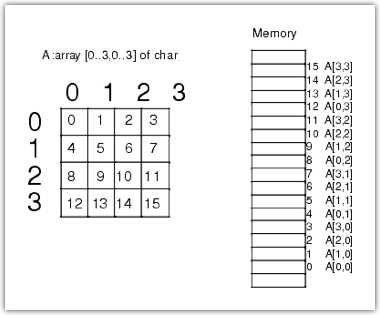 Example of column major ordering Example of column major orderinghttp://blogs.mathworks.com/loren/2007/06/21/indexing-terminology/ |
||||||