|
|
|
|
 | The gravity field was recorded using a Bell Aerospace BGM-3 marine gravimeter. Gravity data was collected throughout the duration of the experiment with measurements taken every 1-second. Gravity measurements were displayed in real-time on a monitor in the main lab. The gravimeter appeared to be functioning properly and producing good quality data. Only the raw data is available upon completion of the cruise. All data processing is performed by LDEO science support staff following the cruise.
|
|
|
|
|
|
| The raw data can be found in: MGL1521/raw/serial/. All the file names are formated as follows: MGL-vc01.yxxxxdzzz where xxxx is the year and zzz is the Julian day on which the samples were collected.
|
|
|
|
|
|
| Bell Aerospace BGM-3 Marine Gravity Meter
|
|
|
|
|
|
| Data is output at 1-second intervals and logged on a LDEO logger system
|
|
|
|
|
|
| The raw gravity measurements are stored as counts. Counts are linearly mapped to mGals using routines kept by LDEO.
|
|
|
|
|
|
 | The raw data for each day is stored in a text file. These files have the following format:
|
|
|
|
|
|
| vc01 year:Julian_day:hour:min:sec (to 4 decimal place) XX:counts YY
|
|
|
|
|
|
| The leading “vc01” identifies the document as gravity readings; “XX” is the output frequency (Hz); The “counts” value is the raw gravity reading (unitless); and “YY” is the sensor status (unitless).
|
|
|
|
|
|
| The location of the gravimeter relative to the navigation reference point (NRP) of the R/V M. G. Langseth is detailed in the attached document, “MGLSensorConfiguration”.
|
|
|
|
|
|
| Calibration: We could not obtain information on the gravitmeter calibration.
|
|
|
|
|
|
| Dropped Scans: All data logged is checked for droped scans using “checktimes_rev”, a LDEO program that checks the time difference between each sample.
|
|
|
|
|
|
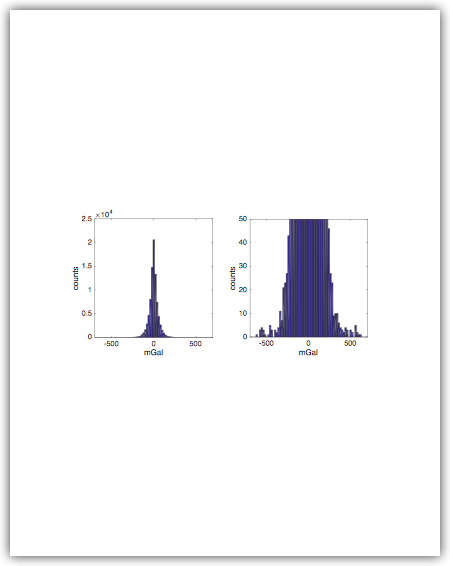
| Spot-checks: Occasionally, the raw gravity counts for a given day were converted to mGals and plotted as a histogram as a first-order check of the data quality (verifying a reasonable range of gravity values is recorded). The attached pdf shows the raw gravity measurements for Julian day 320 of the cruise. A reasonable range of values is recorded with some outliers.
|
|
|
|
|
|
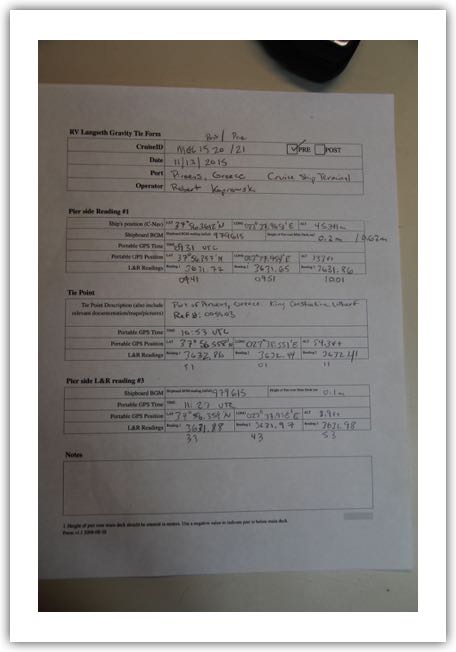
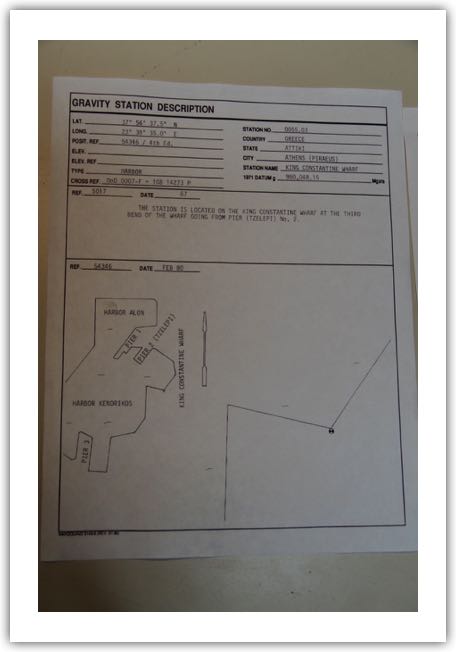
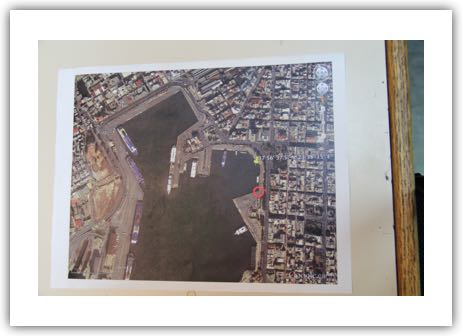
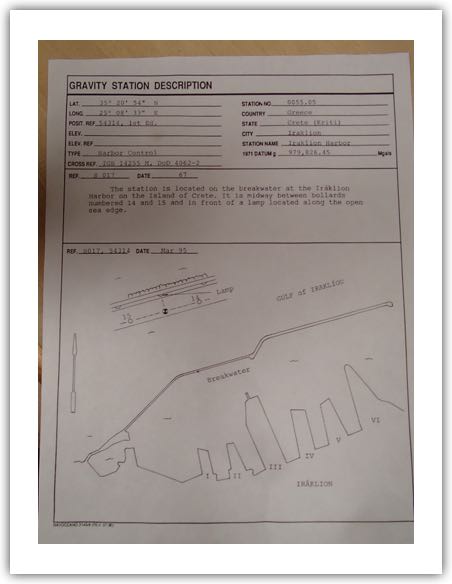
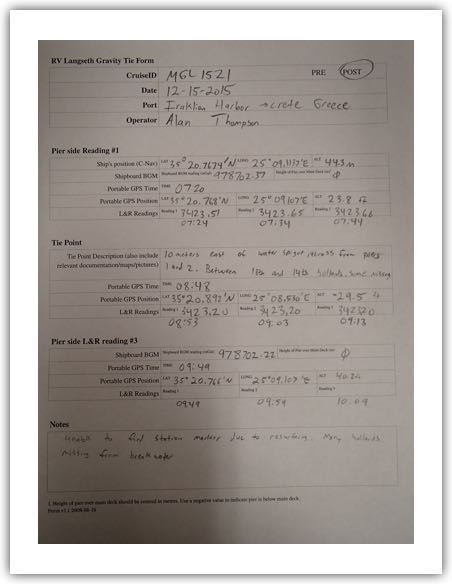
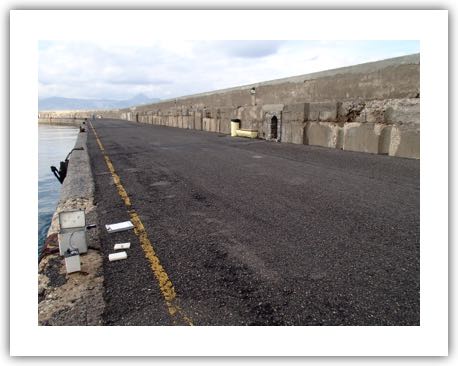
| Gravity Ties: A gravity tie was performed at the cruise ship terminal in Piraeus, Greece on 2015/11/13 at an absolute gravity tie point prior to departure using a LaCoste Romberg G portable gravimeter by LDEO science personnel, Robert Koprowski. A second gravity tie was performed at the conclusion of the experiment in Heraklion on 2015/21/15 (performed in same manner as the first). The gravity tie form and documents describing the station locations are attched below.
|
|
|
|
 |
|
|
| MGL1521_Start_Mission_Gravity_Tie_Form.jpg
|
|
|
|
|
|
|
| MGL1521_Start_Mission_Gravity_Tie_StationDescription.jpg
|
|
|
|
|
|
|
| MGL1521_Start_Mission_Gravity_Tie_Map.jpg
|
|
|
|
|
|
|
| MGL1521_End_Mission_Gravity_Tie_PG1.JPG
|
|
|
|
|
|
|
| MGL1521_End_Mission_Gravity_Tie_PG2.JPG
|
|
|
|
|
|
| Drift: Based on the first gravity tie (date), the initial DC shift calculated on YYYY/MM/DD is XX mGals. Based on the second gravity tie (date), the final DC shift calculated on YYYY/MM/DD is YY mGal. From the inital and final DC shifts, the estimated drift of the gravimeter is ZZ mGals/day. Potsdam correction was removed from the absolute gravity tie point as the BGM-3 outputs uncorrected gravity values.
|
|
|
|
|
|
| NOTE! All processing and data reduction is performed by LDEO science support staff following the completion of the cruise. None of the processing routines are available aboard the Langseth. At the time of the cruise completion, only the raw data (see Instrument Detail for raw data format) is available.
|
|
|
|
|
|
| The raw 1-second gravity counts are filtered with a 360-second Gaussian filter. Counts are converted to mGal via a linear relationship. The gravity data is merged with the navigation attributes (latitude, longitude, course, and veocity) via the GPS time stamp. Eotvos correction is then applied to the dataset. Data plots are generated and visually checked to determine satisfactory Eotvos corrections. Data spikes caused by turns and other anomalies are deleted from the dataset. The Free-air anomaly (FAA) is then calculated using the 1987 International Gravity Formula (IGF). The final dataset is decimated to one-minute samples.
|
|
|
|
|
|
| EOTVOS Correction: Corrects for artificial gravity effects due to changes in the ship’s coarse and speed. The correction is given by:
|
|
|
|
|
|
| EOTOVS = [7.5038 * VE* cos(phi)] + [0.004154 * VT]
|
|
|
|
|
|
| Where VT is the ship speed in knots, VE is the eastward component of the ship’s velocity, and phi is latitude in degrees. These velocities are derived from a smoothed GPS navigation using LDEO developed scripts.
|
|
|
|
|
|
| Free-air Anomaly: The FAA reduces the gravity measurements by removing the gravitational effects of the reference ellipsoid. This will be done using an LDEO program. The 1987 IGF is:
|
|
|
|
|
|
| g(phi) = 978032.68 * [1 + 0.00193185138639 * sin2(phi)]/sqrt[1 - 0.00669437999013 * sin2(phi)]
|
|
|
|
|
|
| Where g is absolute gravity and phi is latitude.
|
|
|
|
|
|
| Historical Note: Earlier cruises have used the 1980, 1967, and 1930 gravity formula in calculating the FAA. Since these all differ by a constant, it is necessary to check the formula used in a particular survey prioir to merging data across multiple experiments.
|
|
|
|
|