 ,
, Averaging of electron backscatter and x-ray continuum intensities in multi-element compounds (presentation at IUMAS 2000)
John J. Donovan1 and Andrew Westphal2
1Department of Geology and Geophysics, The University of California, Berkeley, California 94720-4767, USA
2Department of Physics, The University of California, Berkeley, California 94720-7300, USA
Good afternoon. A few years ago, there was a discussion on one of the Internet list servers concerning trace element analyses of carbonate samples, which as we all know, are notoriously sensitive to high beam currents, which is exactly what is necessary for trace element work.
An effect often seen in these cases, is that by the time the background is measured, the sample is no longer there in a useful state. To get around this, one participant wrote in to say that the use of pure quartz might provide a "blank" for measuring background intensity since it has a similar average atomic number.
Now this is an interesting statement, not because it assumes that atomic number is the main contributor to continuum production, that is an accepted hypothesis; but because it begs the question: how should an average atomic number be calculated for compounds? We can suppose two simple methods, one based solely on the number of atoms present, that is, an atomic fraction average Z,
Eq 1.doc
Atomic fraction,  ,
, ![]()
Mass Fraction,  ,
, ![]()
and, the other, a mass fraction average Z. This being the generally recommended procedure.
Table 1.
| Atomic Fraction, Z-bar | Mass Fraction, Z-bar | |
| Quartz (SiO2) | 9.990 | 10.804 |
| Calcite (CaCO3) | 10.000 | 12.568 |
In this table we have calculated the average atomic number of quartz and calcite, using both atomic fraction averaging and mass fraction averaging. If we calculate the average Z using atomic fraction (as our participant in the list server discussion apparently did), indeed, quartz and calcite do have a similar average Z. However, using the traditionally accepted mass fraction method, we calculate an average Z for calcite that is significantly higher.
Table 2.doc
Raw continuum intensities
| Compound | Ic cps l ~ 12 ┼ | Ic cps l ~ 8.4 ┼ | Ic cps l ~ 3.8 ┼ | Ic cps l ~ 2.8 ┼ |
| SiO2 | 15.3 ▒ 0.8 | 49.6 ▒ 0.9 | 15.4 ▒ 0.8 | 2.5 ▒ 0.3 |
| CaCO3 | 15.8 ▒ 0.6 | 49.3 ▒ 0.9 | 20.5 ▒ 0.8 | 3.3 ▒ 0.4 |
| TiO2 | 17.2 ▒ 0.7 | 65.6 ▒ 1.3 | 22.9 ▒ 0.5 | 7.7 ▒ 0.5 |
Continuum absorption correction factors
| Compound | Ic cps l ~ 12 ┼ | Ic cps l ~ 8.4 ┼ | Ic cps l ~ 3.8 ┼ | Ic cps l ~ 2.8 ┼ |
| SiO2 | 1.75 | 1.21 | 1.07 | 1.02 |
| CaCO3 | 2.18 | 1.35 | .99 | 1.06 |
| TiO2 | 2.61 | 1.49 | 1.01 | .995 |
Corrected continuum intensities
| Compound | Ic cps l ~ 12 ┼ | Ic cps l ~ 8.4 ┼ | Ic cps l ~ 3.8 ┼ | Ic cps l ~ 2.8 ┼ |
| SiO2 | 26.7 ▒ 1.4 | 60.0 ▒ 1.1 | 16.4 ▒ 0.8 | 2.5 ▒ 0.3 |
| CaCO3 | 34.4 ▒ 1.3 | 66.5 ▒ 1.2 | 20.3 ▒ 0.8 | 3.5 ▒ 0.4 |
| TiO2 | 44.9 ▒ 1.8 | 97.7 ▒ 1.9 | 23.1 ▒ 0.5 | 7.7 ▒ 0.5 |
Continuum intensity measurements, at 15 KeV, 50 nA, 30 sec each, average of 10 points. Beam drift corrected intensities reproted in counts per second, acquired at 0.01 sinf above the actual line positions for Na Ka, Al Ka, K Ka and Ti Ka.
I will skip presenting a complex table and only say, that after correction for continuum absorption and anisotropy (Small, et al.), careful measurements of x-ray continuum at various energies show that calcite produces a significantly higher x-ray continuum than quartz. So the data would appear to support the use of mass fraction averaging, as is traditionally accepted.
But why should mass fraction averaging allow us to predict continuum intensities for compounds? After all, x-ray continuum is simply the interaction of incident electrons with the Coulombic field of the atom, which in turn is produced by the total charge of the protons and electron, that is, Z. Mass fraction averaging is based on atomic weight, which is the mass of the protons, electrons and neutrons.
Let's try an experiment in which we carefully measure x-ray continuum in samples, where the only difference is the number of neutrons. Specifically, stable isotopes of the same element.
In this experiment, we compare samples of normal Cu (mass 63.54), and enriched 65Cu; normal Ni (mass 58.71) and enriched 60Ni; and normal Mo (mass 95.94) and enriched 100Mo.
If the presence of the neutron affects the production of x-ray continuum, then we should see a measurable difference in the intensities between isotope pairs.
Fig 1.doc (BSE3, ContNa.grf, ContAl.grf, ContFe.grf and ContK.grf)
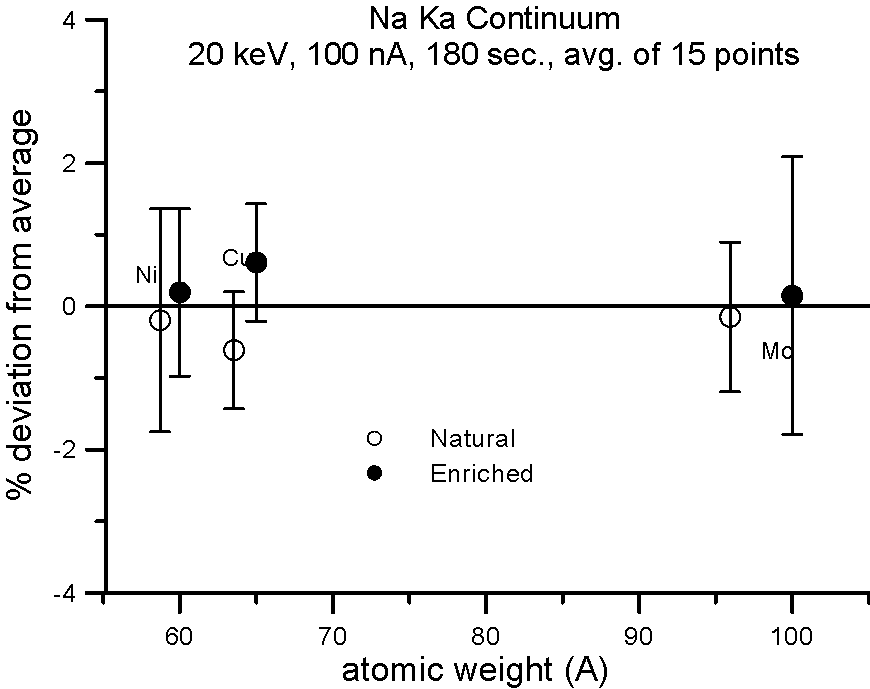
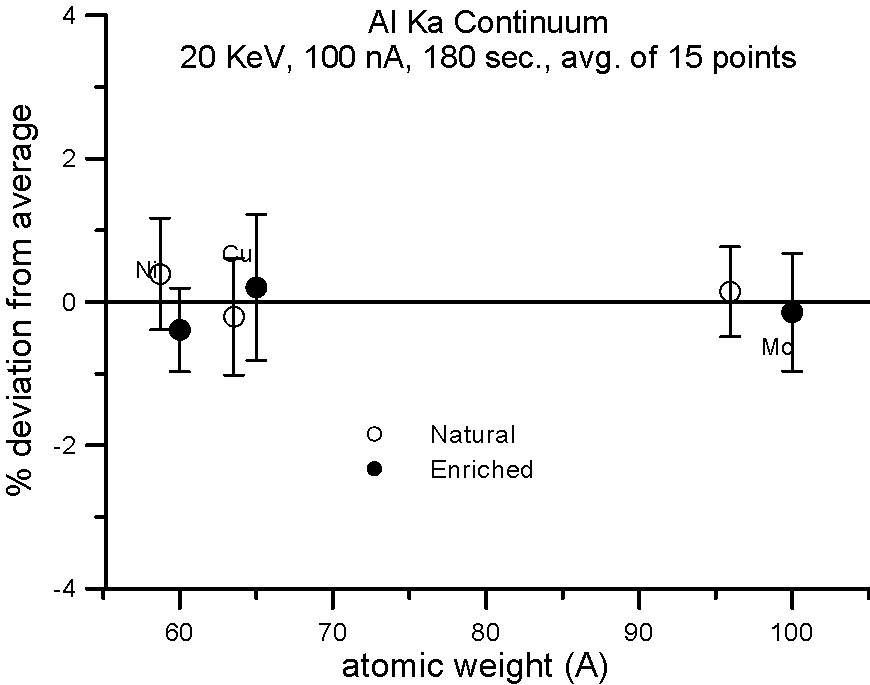

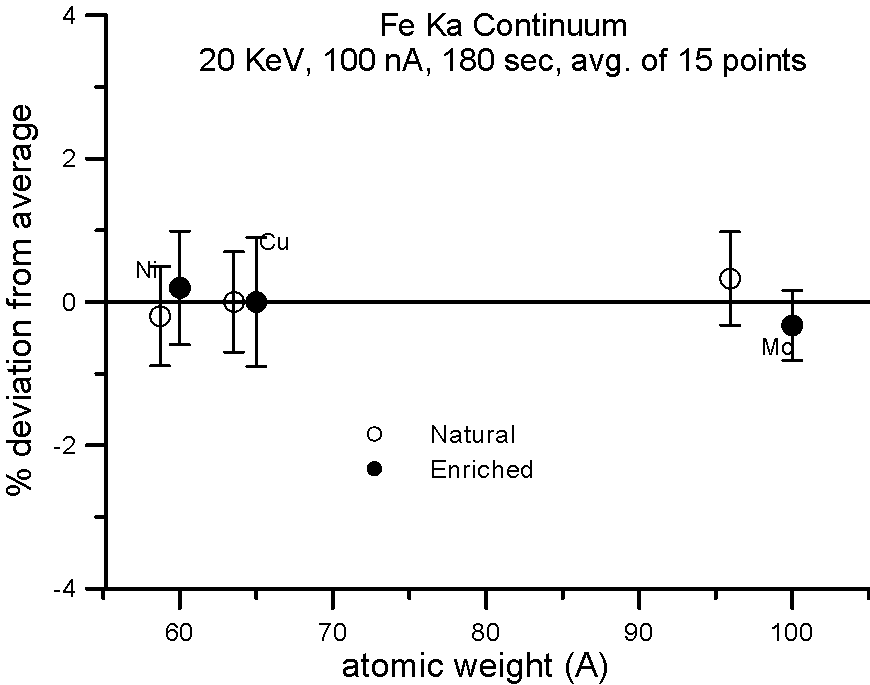
In fact, we don't. Although differences in atomic weight between the natural abundance and enriched isotopes range from 2.2 to 4%, the measured variance is approximately 1%, which is within statistics. So, the property that we call mass, represented by the additional atomic weight of the neutron, does not seem to affect x-ray continuum production.
Nevertheless, mass fraction averaging appears to work in practice, certainly better than atomic fraction averaging. Is there another method we can use that is not related to mass?
Eq. 2.doc

![]()
Yes. In fact, Raymond Castaing even mentioned it in his seminal 1960 paper. As has been remarked by many investigators, the ratio A/Z is approximately a constant, so any property that scales with mass, should also approximately scale with Z. We could call this fractional scaling method, Z fraction, or electron fraction since both the number of electrons and protons are equal to Z.
So, the calculation for average Z is similar as for mass fraction, but we simply substitute electron fraction for mass fraction. Now we have an expression that should produce similar results, but based on Z, not A.
How to evaluate this expression? Well, there are at least two ways one can test their performance. One method is to plot the measured property versus a calculated average Z, and observe how well the property can be fit to a function of some sort. The problem is that it is not always clear what function the measured property fit should fit.
The other method is to assume, that the property can be averaged by interpolating the pure element property to a binary compound, as seen here,
Eq 2a.doc
(mass fraction, Goldstein, et. al., 1992)
(electron fraction, this work, 2000)
So let's plot some property averages of x-ray continuum interpolated from pure elements using both models and see what we get.
Fig 2. (C:\BSE4, AuCuAg…)
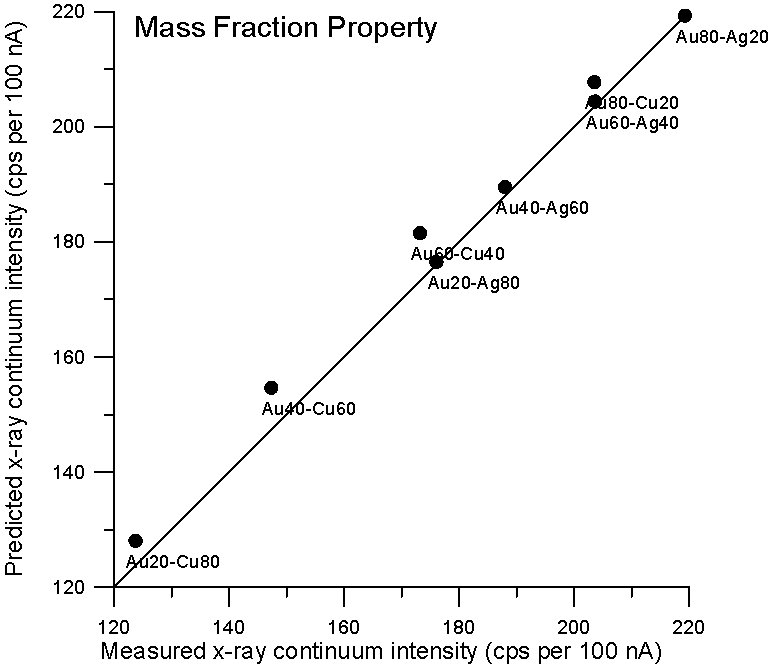
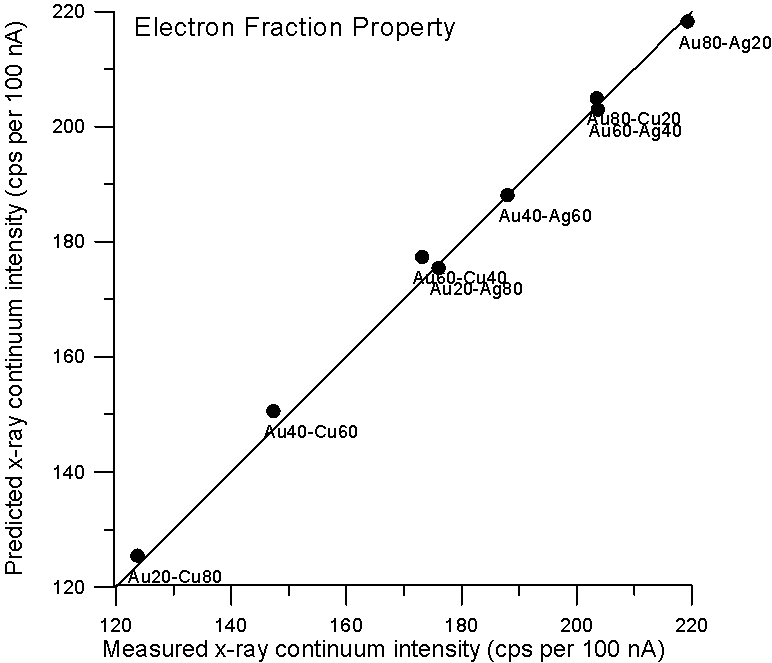
Although, the improvement using a purely Z based model is small for these binary alloys, it is clear that there is no need to resort to a mass based model for predicting x-ray continuum in compounds. By the way, the measurement errors are about 1%, which is smaller than the symbol size.
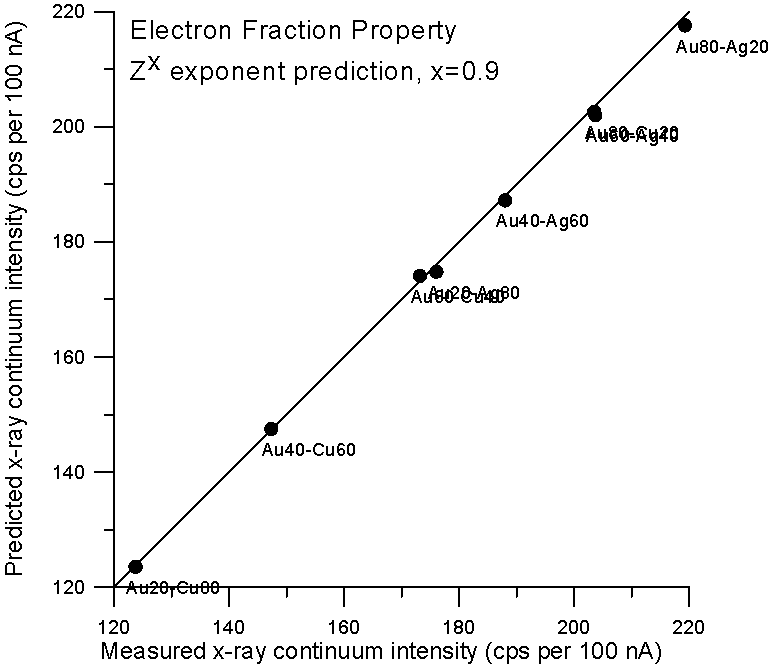
Now, since the effective Coulombic field of the atom does not vary linearly with Z, it is not unreasonable to expect the dependency of continuum production to be at least slightly non-linear with Z also. Therefore, we could adjust the Z fraction exponent to obtain a better prediction, and as we see here, a Z0.9 fraction gives a very good prediction for x-ray continuum. Now we come to the second part of our story- electron backscatter.
Castaing (1960), Heinrich (1966), Ducumb and Reed (1968), and Joy (1995) have all suggested that mass fraction averaging gives reasonable results for backscatter in compounds, although there have been attempts in the literature to find alternative methods. (See Saldick and Allen (1954), Joyet et. al. (1953), Hohn and Niedrig (1972) and BŘchner (1973), Everhart (1960) and Danguy and Quivy (1956)).
But what evidence is there that mass actually affects the production of backscatter electrons? Well we can do the isotope experiment again, and this time measure absorbed current on the isotope pairs.
Fig 3.doc
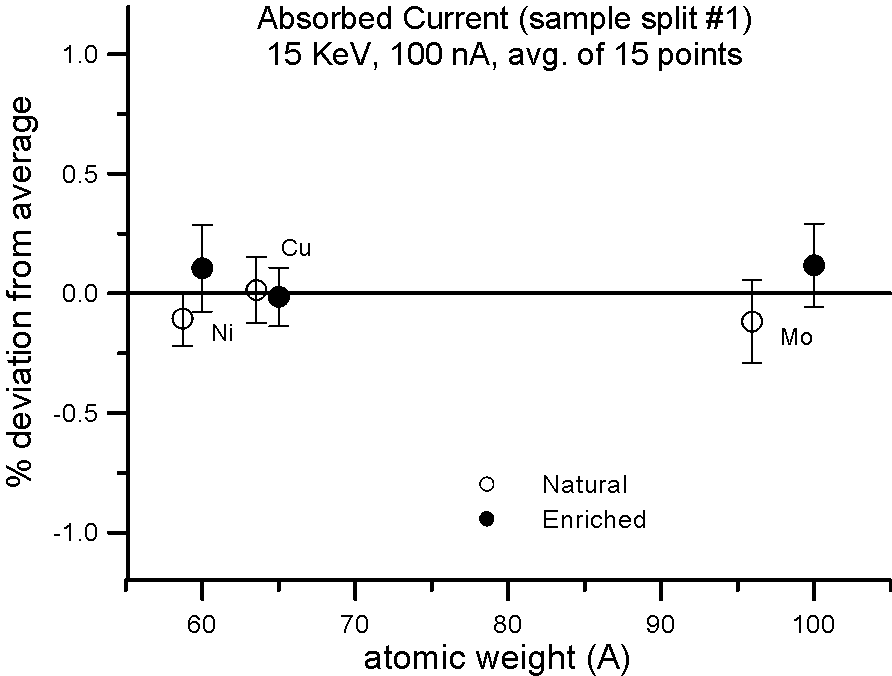
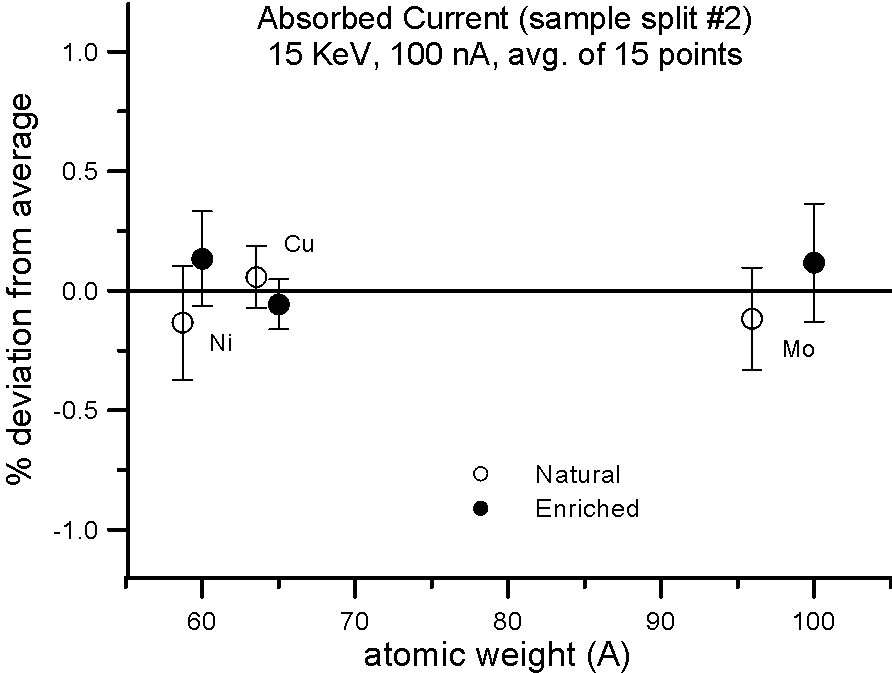
This figure, shows results for absorbed current, measured on two different splits of the isotope pairs, where again the variance is similar to the precision levels, that is, roughly an order of magnitude smaller than the difference in mass between the isotope pairs.
So again, it would appear that mass, manifested by the presence of the neutron, cannot justify it's frequent appearance in models that predict average backscatter.
Are there other methods not based on mass that might be employed? Once again, we can try electron fraction averaging.
Let's compare atomic, mass and electron fraction predictions for backscatter (calculated from faraday and absorbed current measurements with a 22.5 volt sample bias) for the same binary alloys using these expressions:
Eq 5.doc
(atomic fraction)
(mass fraction, Heinrich, 1966)
(electron fraction, this work, 2000)
where ![]() is the atomic,
is the atomic, ![]() is the mass, and
is the mass, and ![]() is the electron
fraction of elements A and B.
is the electron
fraction of elements A and B.
Fig 4.doc

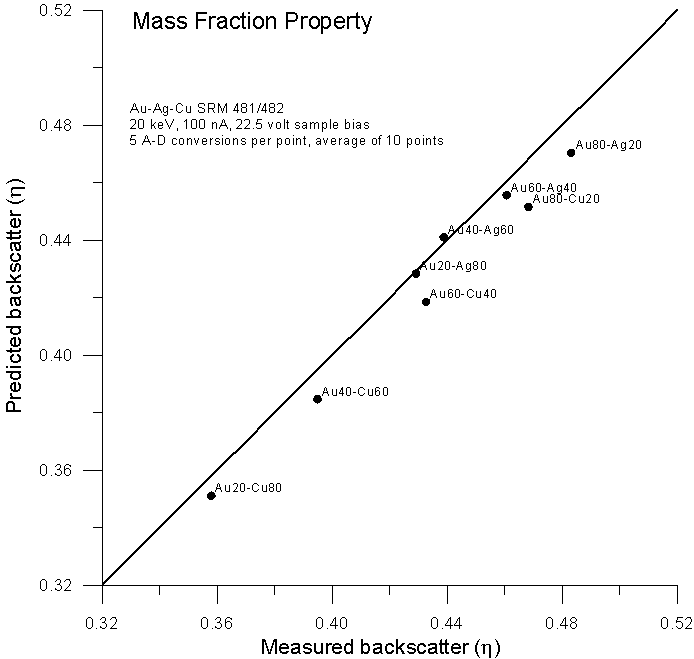
As expected, predictions based on atomic fraction averaging are quite poor. However, using mass fractions (as originally proposed by Castaing) we get fairly reasonable predictions. What about predictions using electron fractions?
Fig 4b.doc


As Castaing no doubt must have noticed, we can see that electron fraction averaging gives a prediction slightly worse than the mass fraction method. But why?
The answer is actually quite obvious when you think about it. The simple electron fraction method, that is, Z to the power of one, assumes that all orbital electrons (actually protons in the case of backscatter), have an equal effect on the production of backscattered electrons. In fact, due to nuclear screening effects in atoms of higher atomic number, some compensation is necessary.
John Armstrong in a paper in Electron Probe Quantitation did exactly this by formulating an equation for elastic scattering cross section to account for this screening effect seen here,
Eq 6.doc

![]()
This expression produces results that vary only slightly with
electron energy. To calculate an elastic scattering fraction for
compounds, we will assume that the averaging is based the
additivity of the elastic scattering weighted atom proportion of
each element in the compound. The elastic scattering fraction, ![]() ,
is therefore this expression,
,
is therefore this expression,
Eq 7.doc

where ![]() is the atomic proportion and
is the atomic proportion and ![]() is the
total elastic scattering cross section as defined by Armstrong.
The interpolated backscatter is then calculated in the same way
as other fractional methods, using this expression:
is the
total elastic scattering cross section as defined by Armstrong.
The interpolated backscatter is then calculated in the same way
as other fractional methods, using this expression:
(elastic fraction)
Using this elastic scattering fraction, in which the only variables are Z and incident energy, we find that predictions based on Armstrong's expression are better than even the mass fraction expression.
Fig 4a.doc

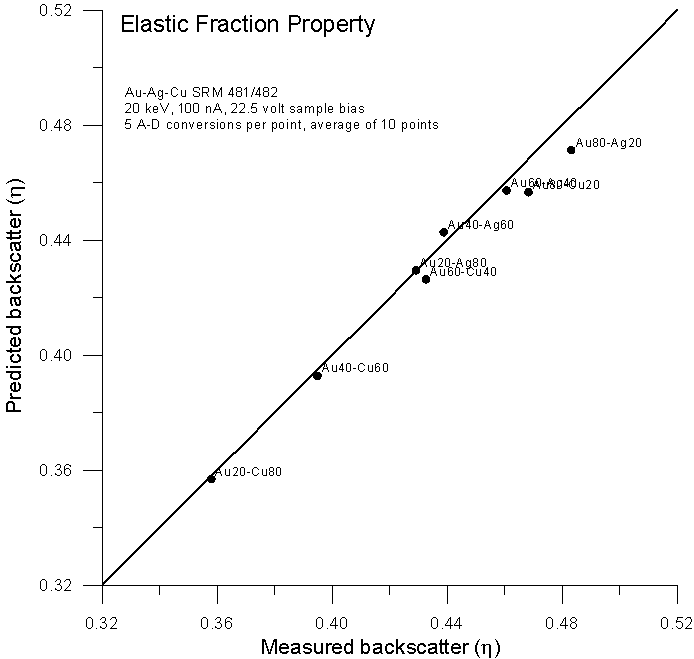
So far so good. Now let's muddy the waters a bit. Let's plot the same data, but this time using the using the previously mentioned alternative method of plotting the measured property versus a calculated average Z.
Based on the fractional averaging methods we have already looked at, we can calculate average Z using the following equations for atomic, mass, electron and elastic fractions,
Eq. 8.doc
![]() (atomic
fraction average)
(atomic
fraction average)
![]() (mass
fraction average)
(mass
fraction average)
![]() (electron fraction average)
(electron fraction average)
![]() (elastic fraction average)
(elastic fraction average)
Fig 5.doc

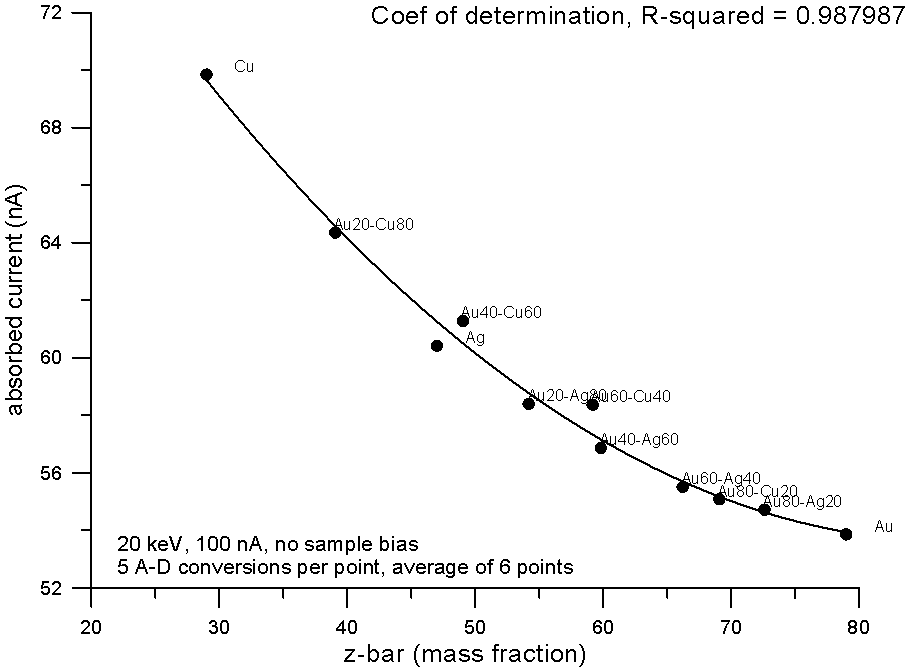
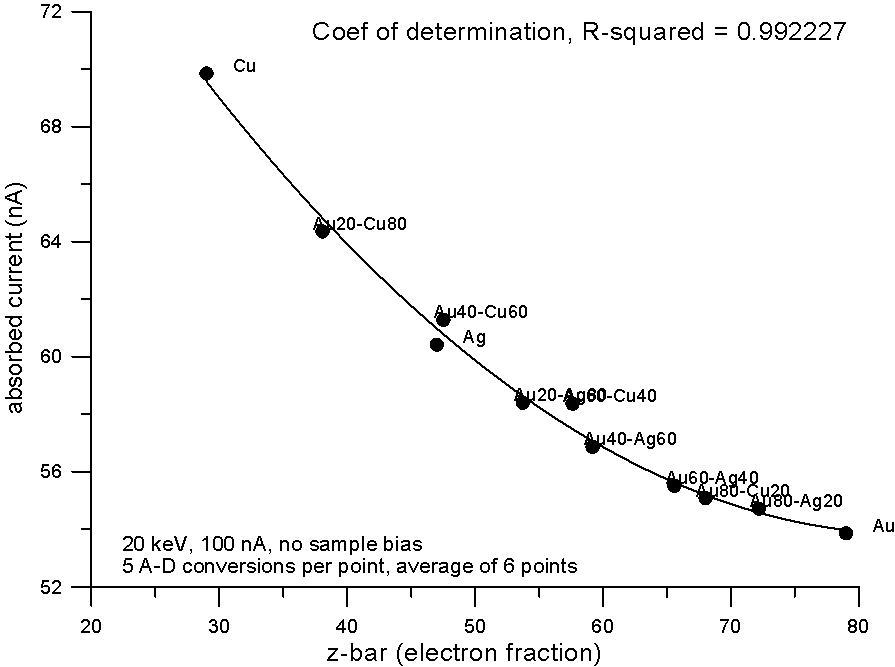

Plotting the measured data and fitting to a 2nd order polynomial, we can see, "surprise, surprise", that now the best correlation is shown by the electron fraction method. What does this mean?
Well I think it means that fractional property averaging, by assuming a straight line interpolation, is not mathematically equivalent to fitting atomic number averaged data to an equation with order greater than one.
Actually this should not surprise us too much, because a plot of backscatter vs. any average Z is definitely not a straight line. In fact it curves in a very special way.
How does it curve? Here, are some plots of monte-carlo data, using the NIST MQ software, where backscatter yields for various compounds are plotted versus mass and electron fraction average Z.
Fig 6.doc
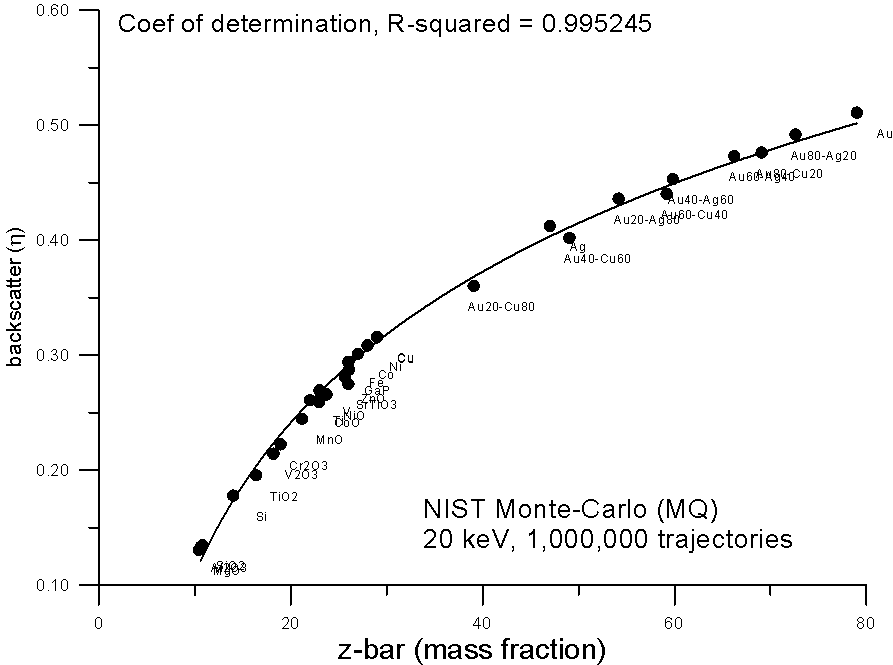
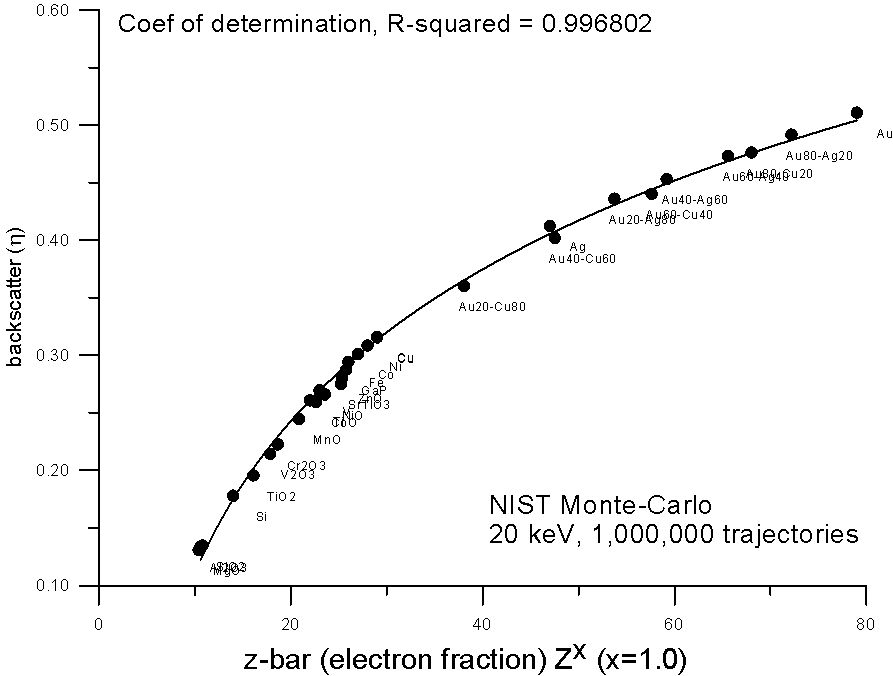
As you can see, both methods show reasonable fits to a 2nd order polynomial, the electron fraction fit being very slightly better.
But again, due to nuclear charge screening effects, we can expect that electron fraction averaging should not be strictly linear with increasing Z, so we can adjust the exponent of the equation. And here we see that an electron fraction average based on Z0.8 yields a very smooth fit to the monte-carlo calculations.
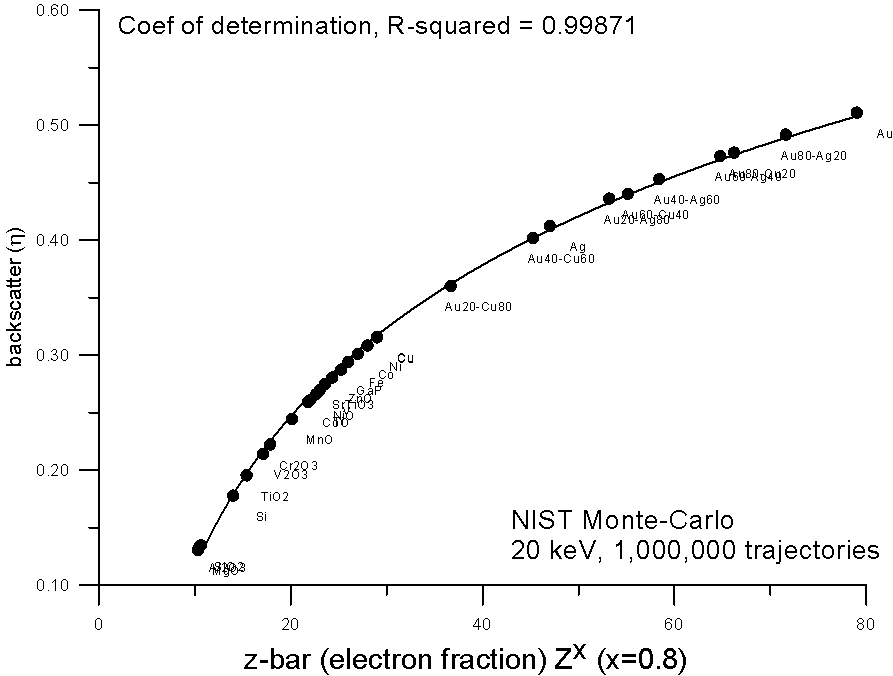
Now, to get back to my earlier question: what is so special about this curve? Well for one thing, the slope of the curve decreases with increasing Z. Now if we wanted to perform a simple straight line interpolation of average backscatter (as Castaing and Heinrich did in the '60's), based on a fractional scaling method, what method would we require? Well we would require a method that scales in such a way that it tends to "cancel out" this decreasing slope of backscatter yield with Z. And that is exactly what mass fraction averaging does.
Fig 7.doc
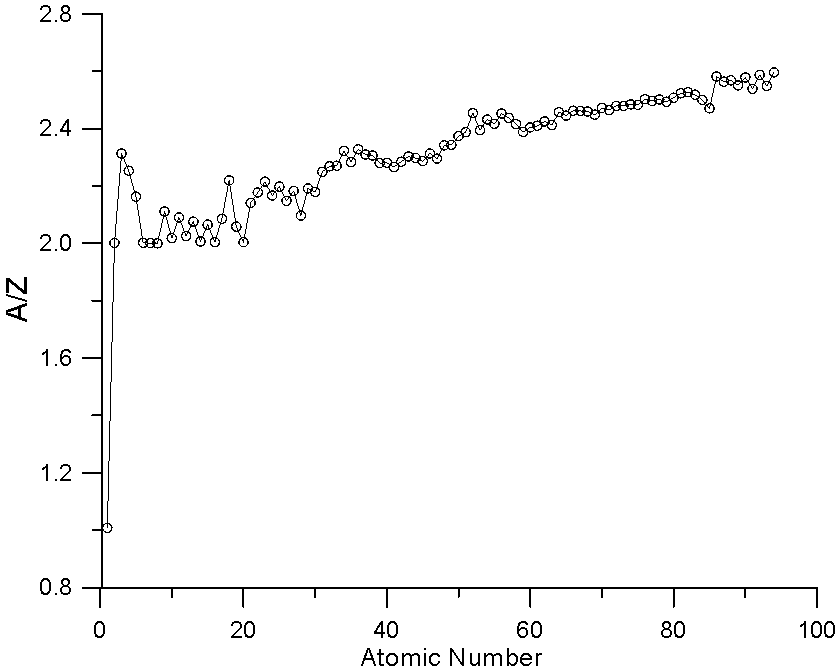
Here is a plot of A/Z versus Z. As you can see A/Z increases faster than Z. This scaling effect of atomic weight in mass fraction averaging helps to compensate for the fact that the slope of the backscatter yield curve decreases with increasing Z, when straight line property averaging has been traditionally utilized (by Castaing and Heinrich),
Eq 9.doc
![]() (mass
fraction property average)
(mass
fraction property average)
What this means is that we are simply taking advantage of the serendipitous manner in which mass fraction scales with Z.
This was pointed out very nicely by John Armstrong in the same paper I cited earlier, in which he plotted relative elastic scattering cross sections and relative atomic weights. Let's take a look at some of these, along with Z to various exponents, plotted for comparison.
Fig 8.doc
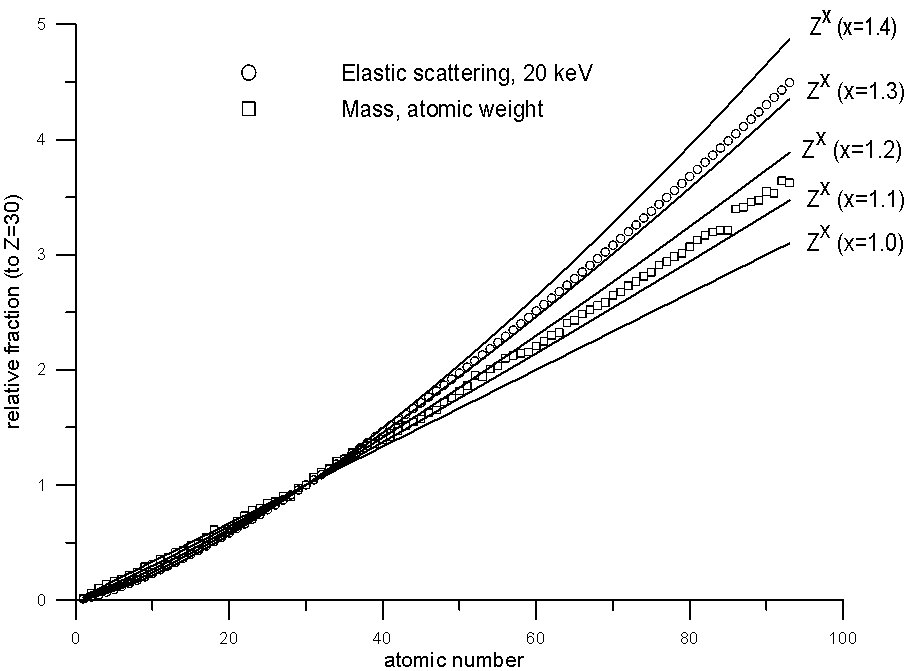
It is clear that while atomic weight scales roughly with elastic scattering (certainly better than Z1.0), it does deviate significantly at the higher atomic numbers, which I suspect is at the heart of certain problems with the atomic number correction that have been reported with Si/Ir and Si/Pb compounds, incidentally, both of which contain elements with extremely disparate A/Z ratios.
Now, getting back the differences between property averaging and atomic number averaging, what if we modify the exponent of the electron fraction to utilize an exponent similar to one we would obtain from a parameterized elastic scattering expression? Which as we can see, is between Z1.3 to 1.4?
Fig 9.doc

Here is the previously shown elastic fraction averaged backscatter data for comparison, and here, is the data using an electron fraction average, modified for Z1.3.
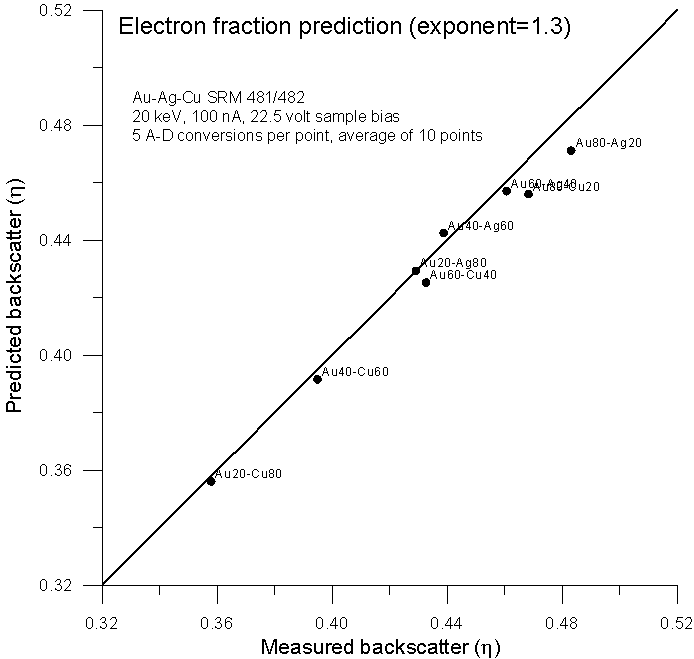
Not surprisingly, we get virtually the same prediction as the elastic scattering model from Armstrong and Newbury, both averaging methods based only on the number of atoms and atomic numbers of the elements present. In conclusion, a few points:
Fig 10.doc
1. High precision measurements of both x-ray continuum and absorbed current of isotope pairs with identical atomic numbers, indicate that mass does not affect electron-solid interactions for these two basic properties. Certainly down to precision levels that can be attained on the electron microprobe.
2. Absorbed current measurements on binary alloys (with voltage biased samples), using electron fraction averaging, will produce improved backscatter yield predictions if the exponent is slightly adjusted for the nuclear screening effects, that are so visible in the curvature of the backscatter curve with respect to Z.
The efficacy of mass fraction averaging is simply due (as Armstrong pointed out) to the serendipitous nature of the manner in which atomic weight scales with Z. At least, for calculating straight line property averages, as originally utilized by Castaing and later, Heinrich and others.
3. X-ray continuum measurements on binary alloys show that simple electron fraction averaging (Zx where x=1) will produce improved intensity predictions when compared to traditional mass fraction averaging. This is likely due to the fact that absorption corrected x-ray continuum intensities vary with Z in a fairly linear fashion.
Interestingly enough, when x-ray continuum intensities are not corrected for absorption of the continuum (at least in the case of lower energy lines, which suffer greater absorption), the continuum intensities tend to vary with Z in a manner similar to that of backscatter yield curves. In these cases, the use of mass fraction averaging may result in reasonable predictions for average intensity, but again for exactly the same reason that mass fraction averaging seems to work as well as it does for calculating average backscatter. That is, the serendipitous way in which atomic weight scales with respect to Z.
4. Evaluations of the various methods for atomic number averaging will produce different results depending on the manner in which the measured property varies with Z and the method used to evaluate it (that is, atomic number averaging versus straight line property averaging).
5. Since electron-solid interactions are not affected by mass to any degree measurable in the electron microprobe, a more physically realistic model for calculating average Z should be utilized. One based on atomic number, not atomic weight. We suggest a modified electron fraction. The fact that this modified electron fraction method can also calculate more accurate average x-ray continuum and backscatter yields is also useful.
References
Armstrong, JT (1991) Quantitative elemental analysis of individual microparticles with electron beam instruments, In: Electron Probe Quantitation, Heinrich KFJ and Newbury DE (eds). New York: Plenum Press, pp 261-315
BŘchner AR (1973) Bstimmung der mittleren ordnungszahl von legierungen bei der quantitativen mikrosondenanalyse. Arch EisenhŘttenwesen, 44:143-147
Castaing R (1951) Ph.D. thesis, University of Paris
Castaing, R (1960) In: Advances in Electronics and Electron Physics, Marton LL and Marton C (eds), New York: Academic Press, 13:317-386
Colby JW (1966) In: The Electron Microprobe, McKinley TD, Heinrich KFJ, and Wittry DB (eds), New York: J. Wiley & Sons
Danguy L and Quivy R (1956) RÚtrodiffusion (backscattering) des Úlectrons par les solutions et les alliages. J Phys Rad 16:320
Duncumb P and Reed SJB (1968) In: Quantitative Microanalysis, Heinrich KFJ (ed). National Bureau of Standards Spec. Pub. 298, p 133
Everhart TE (1960) Simple theory concerning the reflection of electrons from solids. J. Appl Phys 31:1483-1490
Goldstein JI, Newbury DE, Echlin P, Joy CE, Fiori C, Lifshin E (eds) (1981) Scanning Electron Microscopy and X-ray Microanalysis. New York and London: Plenum Press, p 319
Goldstein JI, Newbury DE, Echlin P, Joy DC, Romig AD, Lyman CE, Fiori C, Lifshin E, (eds) (1992a) Scanning Electron Microscopy and X-ray Microanalysis. 2nd Ed. New York and London: Plenum Press p 420
Goldstein JI, Newbury DE, Echlin P, Joy DC, Romig AD, Lyman CE, Fiori C, Lifshin E, (eds) (1992b) Scanning Electron Microscopy and X-ray Microanalysis. 2nd Ed. New York and London: Plenum Press p 118
Heinrich KFJ (1963) In: Advanced in X-ray Analysis, Vol. VII, Mueller WM, Mallett G, and Fay M (eds). New York: Plenum Press, p 325
Heinrich KFJ (1966) Electron probe microanalysis by specimen current measurement. X-ray Optics and Microanalysis, Castaing R, Descamps P and Philibert J (eds). Paris: Hermann, p 159-167
Heinrich KFJ (1968) In: Quantitative Electron Probe Microanalysis. Heinrich KFJ (ed). Nat'l. Bur. Standards Spec. Publ. 298, p 8
Herrmann R and Reimer L (1984) Backscattering coefficient of multicomponent specimens. Scanning, 6: 20-29
Hohn FJ, Niedrig H (1972) ElektronrenrŘckstreuung an dŘnnen metall-und isolatorschichten. Optik, 35:290-295
Howell PGT, Davy KMW, Boyde A (1988) Mean atomic number and backscattered electron coefficient calculations for some materials with low mean atomic number. Scanning, 20:35-40
Joy D, (1995), Mote carlo Modeling for Electron Microscopy and MicroAnalysis, Oxford University Press, New York and Oxford, p 83
Joyet G, Trumpy-Eggenberger C, Mauderli W (1953) The dosage of gamma radiation at very high energies. Baden, Switzerland: The Brown Boveri Betatron, Brown Boveri and Co. Ltd. 36-46
McMaster WH, Kerr Del Grande N, Mallet JH, Hubbell JH (1969) Compilation of x-ray cross sections. Livermore, California: Lawrence Livermore Laboratory Press
Muller RH (1954) Interaction of beta particles with matter. Phys Rev 93:891-892
Myklebust RL, Newbury DE (1991) The R Factor: The x-ray loss due to electron backscatter. In: Electron Probe Quantitation Heinrich KFJ, Newbury DE (eds). New York, Plenum Press, pp 177-190
Newbury DE, Myklebust RL, Heinrich KFJ, Small JA (1980) Monte carlo electron trajectory simulation, an aid for particle analysis. In: Characterization of Particles Heinrich KFJ (ed), NBS Special Publ. 460, pp 39-62
Reed SJB (1993) Electron Microprobe Analysis, 2nd Edition, Cambridge: Cambridge University Press, pp 10-11
Saldick J, Allen AO (1954) The oxidation of ferrous sulphate in acid solution by high energy cathode rays. J Chem Phys 22:438-442
Small JA, Leigh SD, Newbury DE, Myklebust RL (1987) Modeling of the bremsstrahlung radiation produced in pure element targets by 10-40 keV electrons. J Appl Phys, 61:2:459-469