
|
|
|
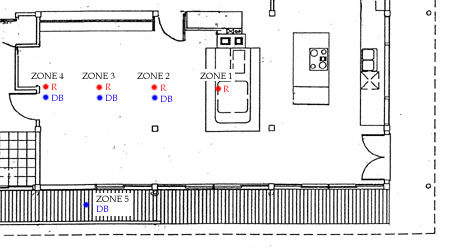
This diagram shows the five zones relative to the location of the stove.
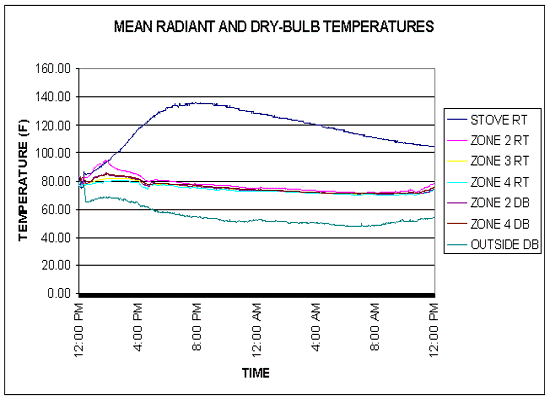
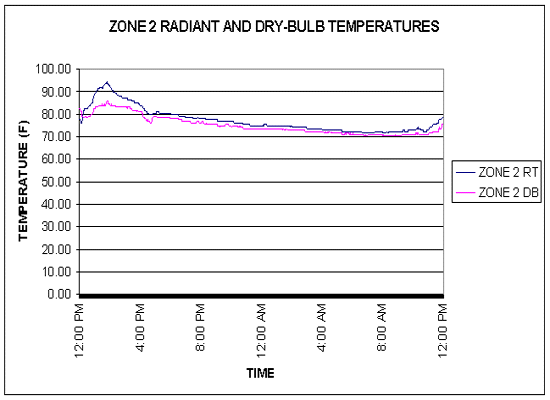
GRAPH 1
This graph shows similar trends in radiant and dry bulb temperature
in the main living space.
On a colder cloudy day the graph would indicate a larger difference
between the radiant and
dry bulb temperatures.
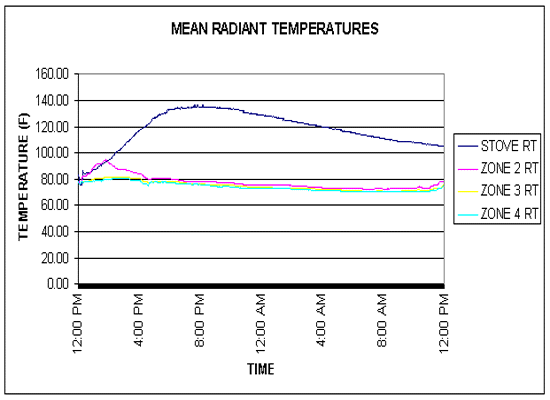
GRAPH 2
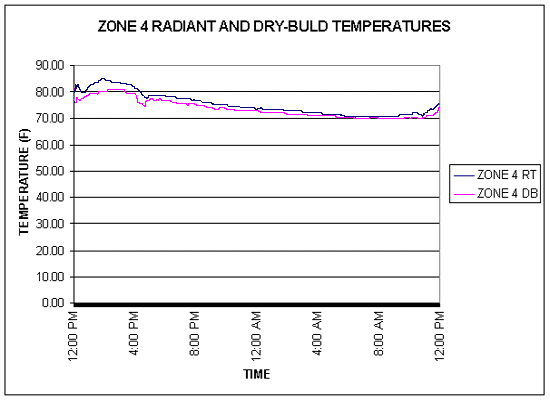
After the initial firing, the radiant temperatures in the main living
room were relatively consistent
between the three zones (zone 2 is 6 feet from stove; zone 3, 12 feet;
and zone 4, 18 feet).
GRAPH 3
GRAPH 4
These charts show a larger difference between radiant and dry bulb
temperatures
in the areas closer to the stove during the initial firing.