|
Third-floor landing, |
 |
 |
Second floor landing, |
|
Second floor landing, |
 |
 |
First-second floor |
Stack Effect in a Glazed Stairwell
Vital Signs Case Study Report
Randolph Fritz & Pete Keller
December 6, 1999
The "stack effect" is a physical property of airflow in a vertical space vented at top and bottom. It occurs when cool air at the bottom is warmed. The warm air rises escapes. The air will then be replaced by air being drawn in at the bottom. This effect can be used to naturally ventilate a building.
As the science of building becomes ecologically aware, many of these more subtle effects will be more closely examined. Is the stack effect powerful enough to be investing building resources in the concept? The answer to that will take many case studies of many different buildings in many places. Our intent here is to provide one of these studies. We would like to show whether a stack effect is measurable in a chosen space.
The stack effect suggests that air movement will correlate to the difference in temperature between the bottom and the top of the space. A large temperature difference should be accompanied by a large amount of airflow. Because the glazing heats the air inside the space, we expected a larger temperature difference on warm days than on cool days.
Eugene Oregon, at the south end of the Willamette River valley of the Pacific Northwest of the USA, has a mild climate with a warm mild summer and a cool gray rainy winter. A through set of maps of the area can be found at [LCATLAS].
| Season | Temperature (°F) | Relative Humidity (%) |
Standard Heating Degree Days (based on 65°F) |
||
|---|---|---|---|---|---|
| Day | Night | Day | Night | ||
| Summer (August) | 81.8° | 53.2° | 39 | 88 | 30 |
| Winter (January) | 46.4° | 35.2° | 51 | 38 | 750 |
A more complete climate summary can be found at [LCDS].
|
|
||||||||
|
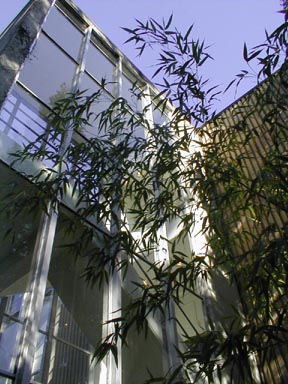
A stairwell in the Lawrence Hall of the University of Oregon in Eugene, Oregon, USA. The space has dramatic thermal properties.
The air movement in the stairwell will correlate with the temperature difference between the top and bottom of the space.
 In order to determine whether a stack effect occurs, we studied whether temperature can be correlated with airflow through the space. If there was, in fact, a stack effect, expected to see a rise in air flow corresponding to a rise in the difference between indoor and outdoor temperatures.
To determine this we took temperature readings at the top and the bottom of the space, and also measured the velocity of the air coming into the space underneath the doors, again at the top and bottom of the space.
All these instruments are described in detail in [VSTK].
We began by leaving the, doors propped open while we measured but this proved to be too influenced by the building's HVAC, and also proved vulnerable to the foot traffic in the space. We got more consistent readings with the doors shut, measuring airflow underneath the doors.
We found that the hot-wire anemometer was sensitive enough to be affected by wind gusts, doors opening and closing, and even the operator's breath. The device must be observed over a period of time, and wind gust effects must be reconciled through human judgment. For our purposes, we probably would have been better off with a logging anemometer.
The heater at the bottom of the stairs was turned on during our measurements.
Towards the end of our measuring, we realized that we'd get more useful air velocity data by recording an error range; we used that as a basis for error ranges in earlier data.
We only found out about the Borozin smoke gun after we had done the main data gathering, and only had time for one set of measurements with it.
|
|
|
|
|||||
| Date and time |
|
|
Third floor landing | ||||
|
Temp. ºF
|
Air Velocity ft/min.
|
Temp. ºF
|
Air Velocity ft/min.
|
Temp. ºF
|
Air Velocity ft/min.
|
||
| Fri. 11/12/99 1900 (note 1,6) |
75
|
200±31
|
70
|
40±4
|
72
|
120±6
|
|
| Sat. 11/13/99 1515 (note 1,6) |
74
|
125±20
|
73
|
10±1
|
72
|
43±2
|
|
| Sun. 11/14/99 1300 (note 3,6) |
70
|
120±19
|
71
|
10±1
|
71
|
40±2
|
|
| Mon. 11/15/99 1500 (note 6) |
70
|
50±8
|
70
|
50±5
|
72
|
35±2
|
|
| Mon. 11/15/99 1645 (note 6) |
72
|
90±14
|
71
|
60±6
|
71
|
15±1
|
|
| Tue. 11/16/99 1900 (note 6) |
69
|
(note 4)
|
64
|
90±10
|
67
|
70±4
|
|
| Wed. 11/17/99 1135 (note 5,7) |
69
|
165±35
|
66
|
60±10
|
66
|
180±5
|
|
| Thu. 11/18/99 1200 (note 7) |
61
|
177.5±7.5
|
60
|
70±10
|
61
|
58.5±4.5
|
|
| Thu. 11/18/99 1330 (note 7) |
60
|
46±10
|
63
|
123±1
|
65
|
37±2
|
|
The following table covers the weather information from the National Climatic Data Center's Surface Weather data set [SURW]. Measurements are taken from the table entry which is closest in time. Centigrade temperatures have been converted to Fahrenheit and rounded to the nearest whole degree. [METAR] is helpful in interpreting the tables.
| Date and time | Weather Conditions | |
| Temp. ºF | Cloud cover, |
|
| Fri. 11/12/99 1900 | 63 |
0
|
| Sat. 11/13/99 1515 | 72 |
1
|
| Sun. 11/14/99 1300 | 55 |
1/2
|
| Mon. 11/15/99 1500 | 63 |
0
|
| Mon. 11/15/99 1645 | 57 |
0
|
| Tue. 11/16/99 1900 | 46 |
0
|
| Wed. 11/17/99 1135 | 52 |
1/2
|
| Thu. 11/18/99 1200 | 41 |
0
|
| Thu. 11/18/99 1330 | 43 |
1
|
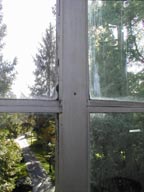
On the landing between the second and third floors, we took two measurements of airflow against the windows.
 |
Date Time |
Inside temp. (°F) |
Outside temp. (°F) |
Air velocity, north window (ft./min) |
Air velocity, south window |
| Fri 1900 | 70 | 63 | 40 | 40 | |
| Sat 1515 | 73 | 72 | 0 | 10 |
Air flow was, in both cases, down.
Study of dust patterns on the door at 16:29 on 23 November (outside temperature approx. 50°F) revealed airflow, and we followed up with tests with the Borozin smoke gun.
| Floor | Location of dust with respect to space |
Direction of draft wrt space |
| 3 | inside | out |
| 2 | outside | in |
| 1 | outside | in |
Apparently the dust accumulates on the side of the door which takes in air, rather as dust accumulates on the intake grill of an air duct.
| Glazing (single) |
approx. 1,300 s.f., north and south |
| Staircase | approx. 750 cf.±25%, concrete |
| East wall | concrete with fire doors, heated space on other side |
| West wall | concrete with brick veneer, outside wall |
| Spaces under doors |
approx. 1 s.f.; the height is roughly 1/3" and the door is 3' wide. |
| Doors | Three four-hour metal (steel?) fire doors; one glazed outside door. |
The staircase apparently "breathes" with the building. Depending on outside and inside temperatures, air flows differently at different times.
According to [MEEB] pages 127-8, the airflow through the space should be approximately:
[ed. CAUTION! ERROR
IN THIS EQUATION. Please refer to ASHRAE Handbook, 2005 Fundamentals,
equation 27.30.]
or , dividing by A
Where:
This formula, however, is pretty plainly an approximation. Apart from the question of what happens when to > ti (when the airflow would become imaginary; the value of Q or v explodes when ti goes to zero. Most likely the formula is most accurate around a particular temperature, probably 72°.
Graphing air velocity against ![]() where ti is taken from measured inside temperature and to is taken from reported outside temperature produces the a chart which does not show the relationship:
where ti is taken from measured inside temperature and to is taken from reported outside temperature produces the a chart which does not show the relationship:
v 
![]()
But, graphing air velocity against the difference between top and bottom temperature in the space, at least suggests a relationship.
v 
![]()
After a lot of thought and analysis, we decided that:
With that in mind, we produced the following chart, which fits all the data very well except for one point:
v 
![]()
As [MEEB] pages 127-8 say, when a sufficient temperature differential builds up, there is a stack effect in the space. However, the temperature differential in the time period we were measuring in seldom was large enough to drive the effect. Surprisingly, though, the reported exterior temperature does not seem to correlate at all with the stack effect. It may be:
We have two further hypotheses covering this:
It is possible that the vertical air circulation of the stack effect is governed by the same principles as horizontal convection. Perhaps the term "stack effect" is misleading in this way, suggesting that the air movement is caused by the vertical property of the space. It seems likely that any lengthy space, whether vertical or horizontal, will display the same convection properties, it is a three degree difference in temperature that is required to move air. This makes physical sense because gravity is a weak force, and the wait for the air to move because of the effects of gravity will be interrupted by the air being pushed around by horizontal density differences. The wind doesn't blow much, up and down.
Perhaps, then, it is unwise to try to design a stack effect into a building, and much better to try to connect a naturally warm outdoor area to a naturally cool outdoor area, wherever these two locations are on the horizontal or vertical planes. A vertical space might be used to do this, but it would function no better than a horizontal space that fulfills the requirement of a three degree temperature difference.
It may be that this space simply doesn't usually get warm enough to produce a substantial stack effect in the fall. In addtion, it seems likely that the thermal masses of staircases and walls actually reduce the stack effect, since they tend to moderate temperature differences. And the glazing is both thin and leaky. It may be that the stack effect is not actually of all that much use in an Oregon fall, or it may be that stacks have to be better designed to take advantage of it. A space designed to effectively produce the stack effect would ideally be better insulated and have either minimum thermal mass or most thermal mass insulated.
[LCATLAS] Lane County Atlas, University of Oregon InfoGraphics Lab, Spring 1998, Winter 1999, ongoing.
[LCDS] Local Climate Data Summaries, Western Regional Climate Center, consulted 12/5/99.
[MEEB] Mechanical and Electrical Equipment for Buildings, 8th Ed., Benjamin Stein, John Reynolds. ISBN: 0-471-52502-2. John Wiley & Sons, Inc., 1992. New York, USA; Chichester, UK; Weinheim, Germany; Brisbane, Australia; Singapore; Toronto, Canada.
[METAR] Surface METAR Observations Users Manual, US Navy, Fleet Numerical Meteorology and Oceanography Detachment, Asheville, NC.
"On the way," preliminary papers and reports on this study. Randolph Fritz and Pete Keller, Fall 1999. Research Proposal, Methodology, Preliminary Results and Analysis.
[SURW] Surface Weather Observations from KEUG, National Climate Data Center, freely available to educational users (.EDU domains) all others pay cash.
[VSP] Vital Signs Project, Cris Benton, Principal Investigator. Center for Environmental Design, University of California at Berkeley, Berkeley, CA, USA. Initiated 1992, ongoing.
[VSTK] "Vital Signs Toolkit Roster," Vital Signs Project, June 1998. PDF format.
Professor Walter Grondzik, for advice and finding the Borozin smoke gun.
Assistant Professor Alison Kwok, former research assistant to Cris Benton, principal investigator of the Vital Signs Project, without whom the subject would be quite different.