 |
|
 |
 |

|
 |
|
 |
|
|
 |
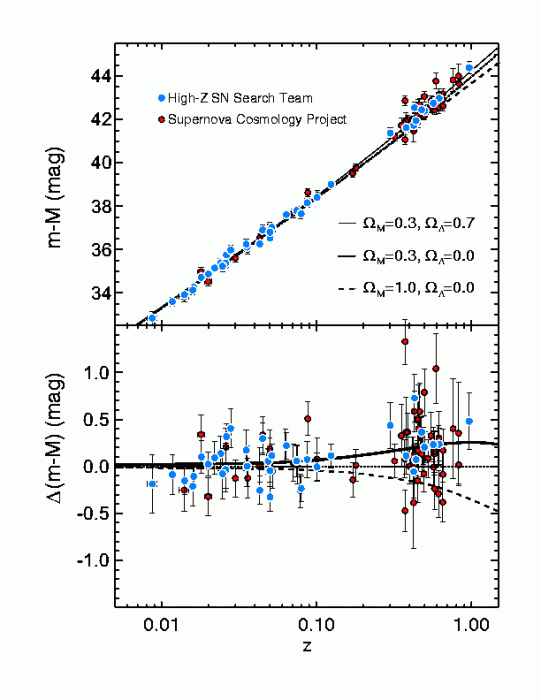 |
Oh my, notice that the authors chose to make their Hubble Law plot in a different way. They used the magnitude difference on the vertical axis (that is, they placed DISTANCE on the vertical axis) and placed redhsift z on the horizontal axis. Nonetheless, their plot shows the SN results in comparision to various models. Their data suggests that Ω is nearly 1 with a substantial Dark Energy component (the upper solid curve). A universe with Ω = 1 with no Dark Energy does not fit as well (the lower dashed curve).
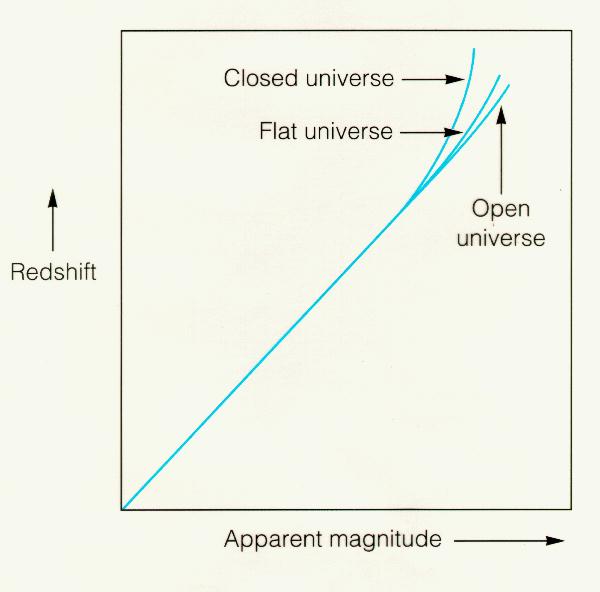
To remind you, the traditional form for the plot when there is no dark energy is shown above. The redshift (velocity) plotted against distance. Notice that all slowing down universes show larger redshift at large distances. The open universe shows the least amount of slowing down at large distances than do either the flat or closed universes.What kind of behavior would a universe with dark energy show at large distance? |
The Type Ia SNe results offered the first credible evidence that Ω = 1 and that the Universe was made primarily of Dark Energy. This was astonishing as it suggested that the expansion rate of the Universe was increasing with time. The later work on the Cosmic Microwave Background Radiation, CMB, by the Wilkinson Microwave Anisotropy Probe, WMAP group, really nailed it, however. |