WEIGHING THE UNIVERSE
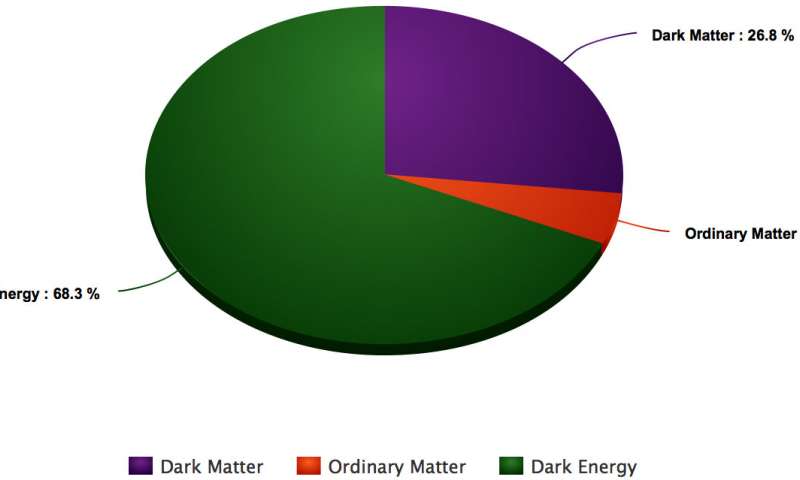
Before we go on, let's remind ourselves of the current composition of the Universe. We will deal with how much stuff that there is in the Universe. Not shown are the photons which make up much less than 1 % of the Universe.
Before we go on, let's remind ourselves of the current composition of the Universe. We will deal with how much stuff that there is in the Universe. Not shown are the photons which make up much less than 1 % of the Universe.
total mass density = baryons + neutrinos + photons + dark energy + ...
Using the above, we define
So the issue becomes what are all of these contributions to Ω?
Before we go on, photons are in there, but why? Aren't photons massless?
→ mass = Energy / c2
The neutrinos (ν) are problematic.
→ ρν = 0.3 ργ and if neutrinos were massless (like the photons) then the CNB does not make a large contribution to the density of the Universe. However, neutrinos are not massless.
Neutrinos may either be important or not important depending upon whether they turn out to have a significant rest mass.
The dark energy is more problematic; it is difficul to measure the dark energy with small z observations, but we'll mention some ideas later.
We can figure out how much of the mass of the Universe is contained in galaxies and galaxy clusters. Define
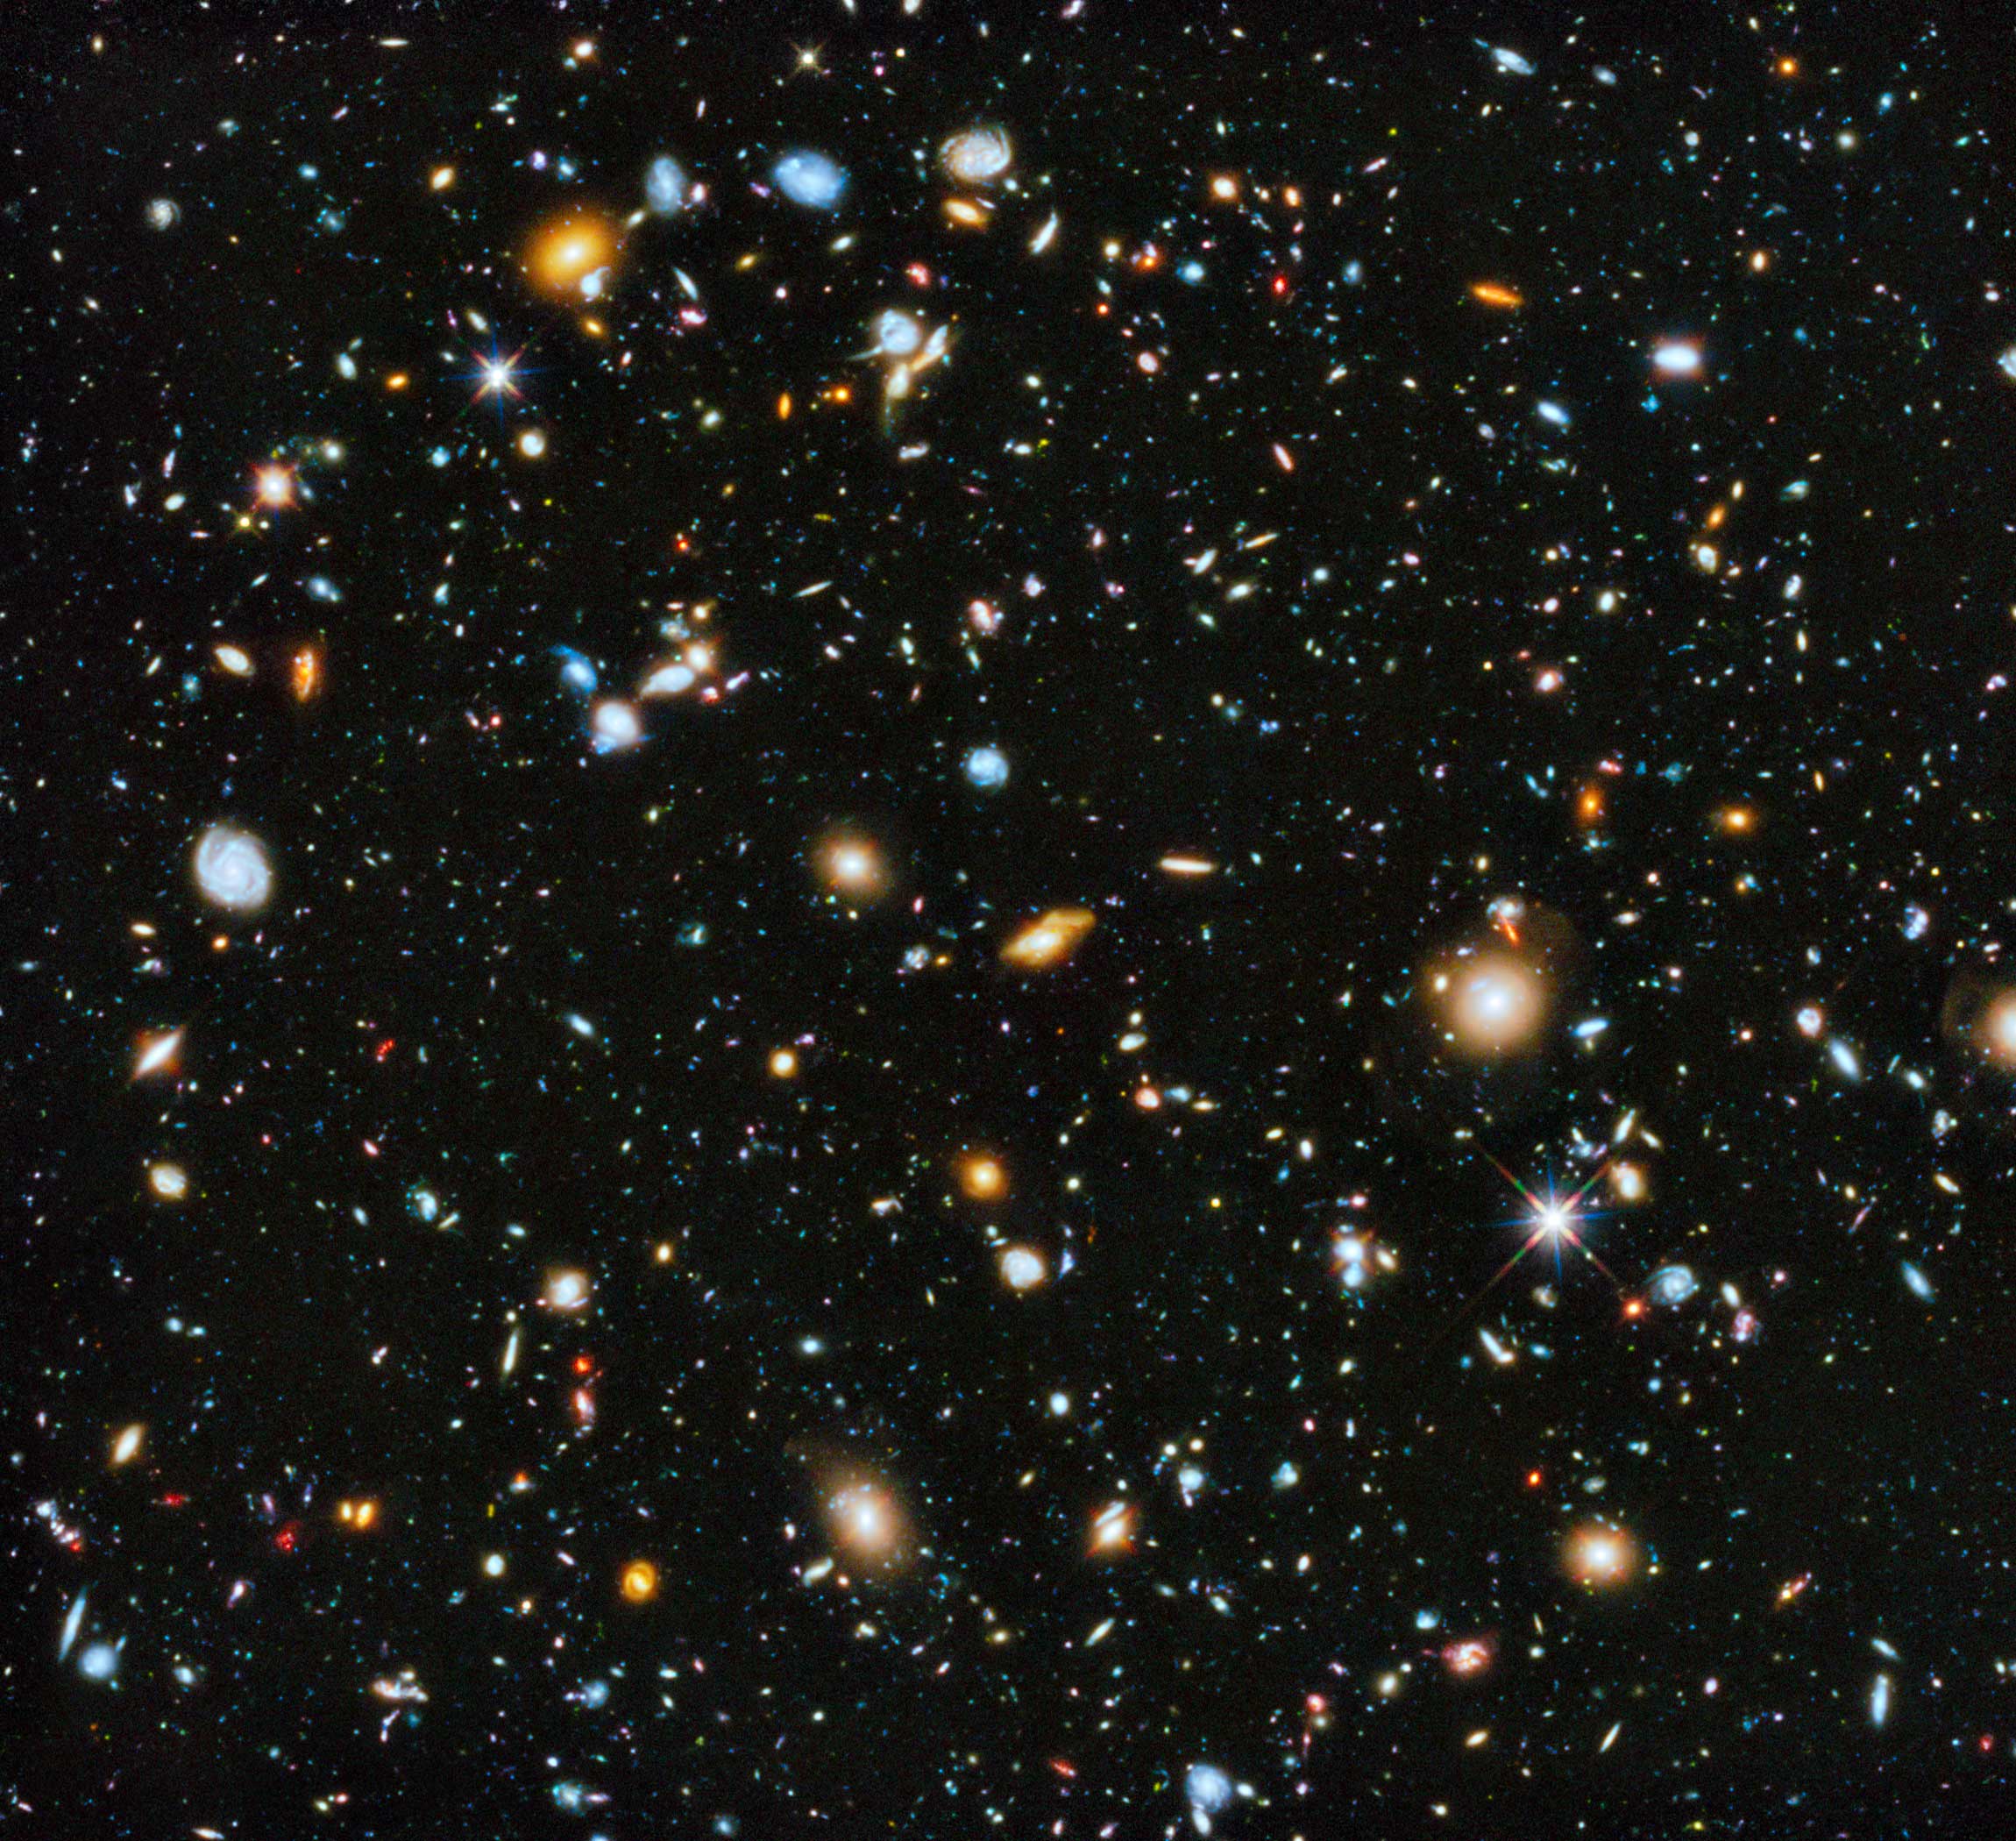 |
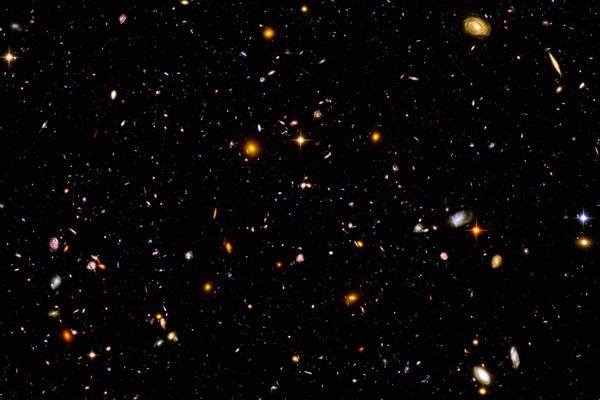
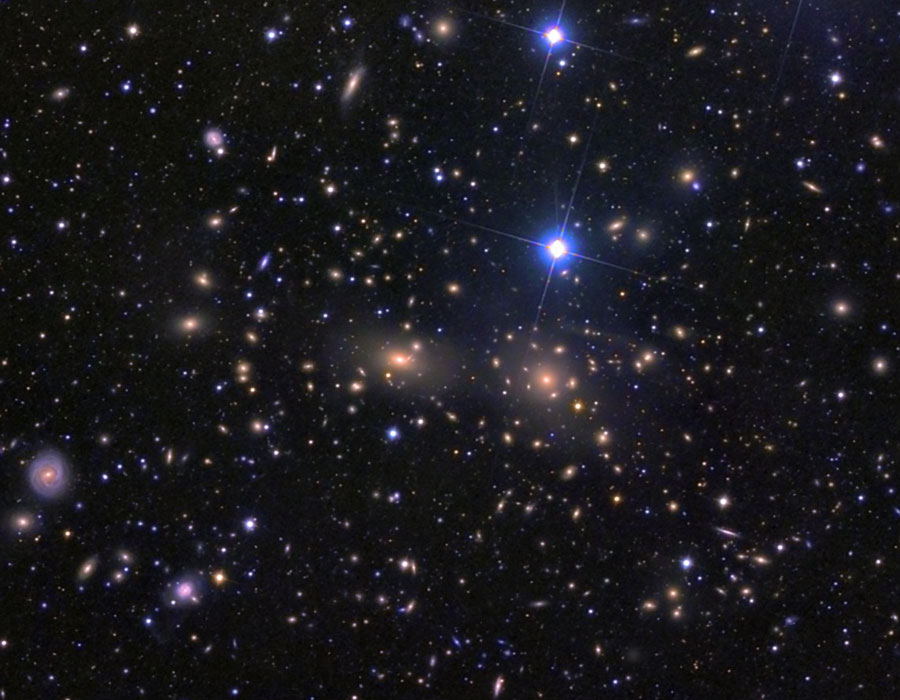
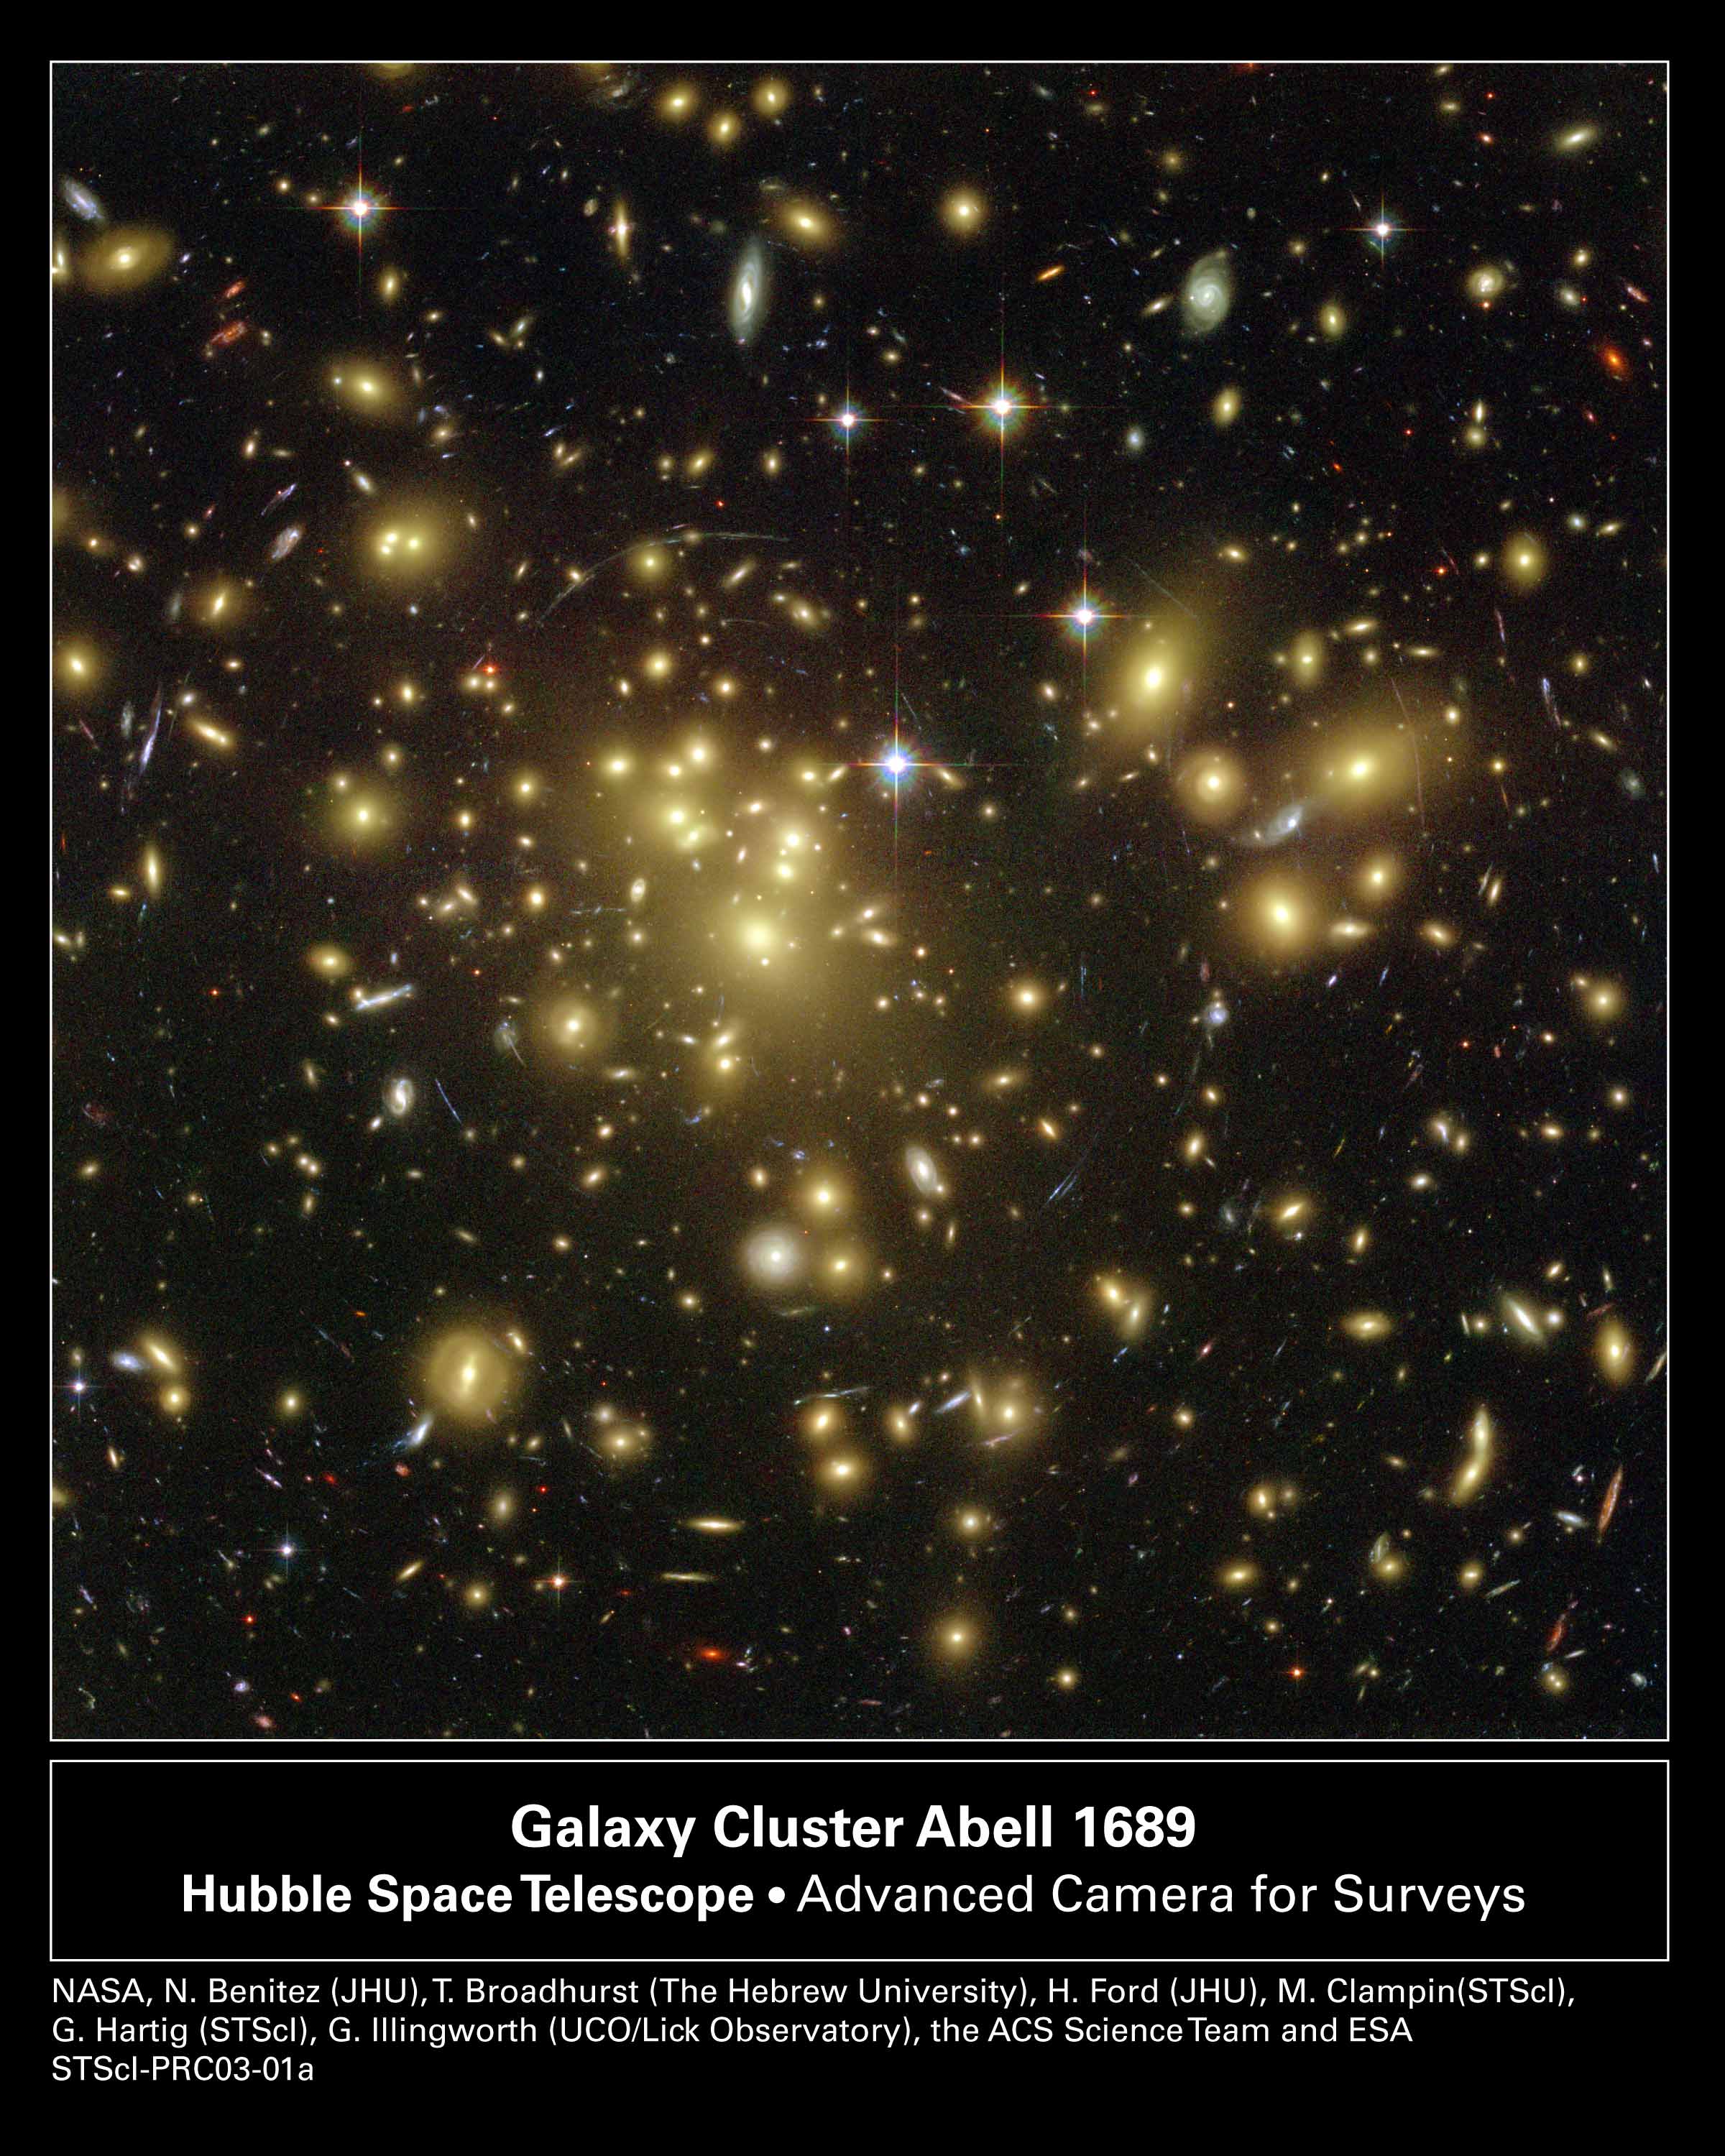
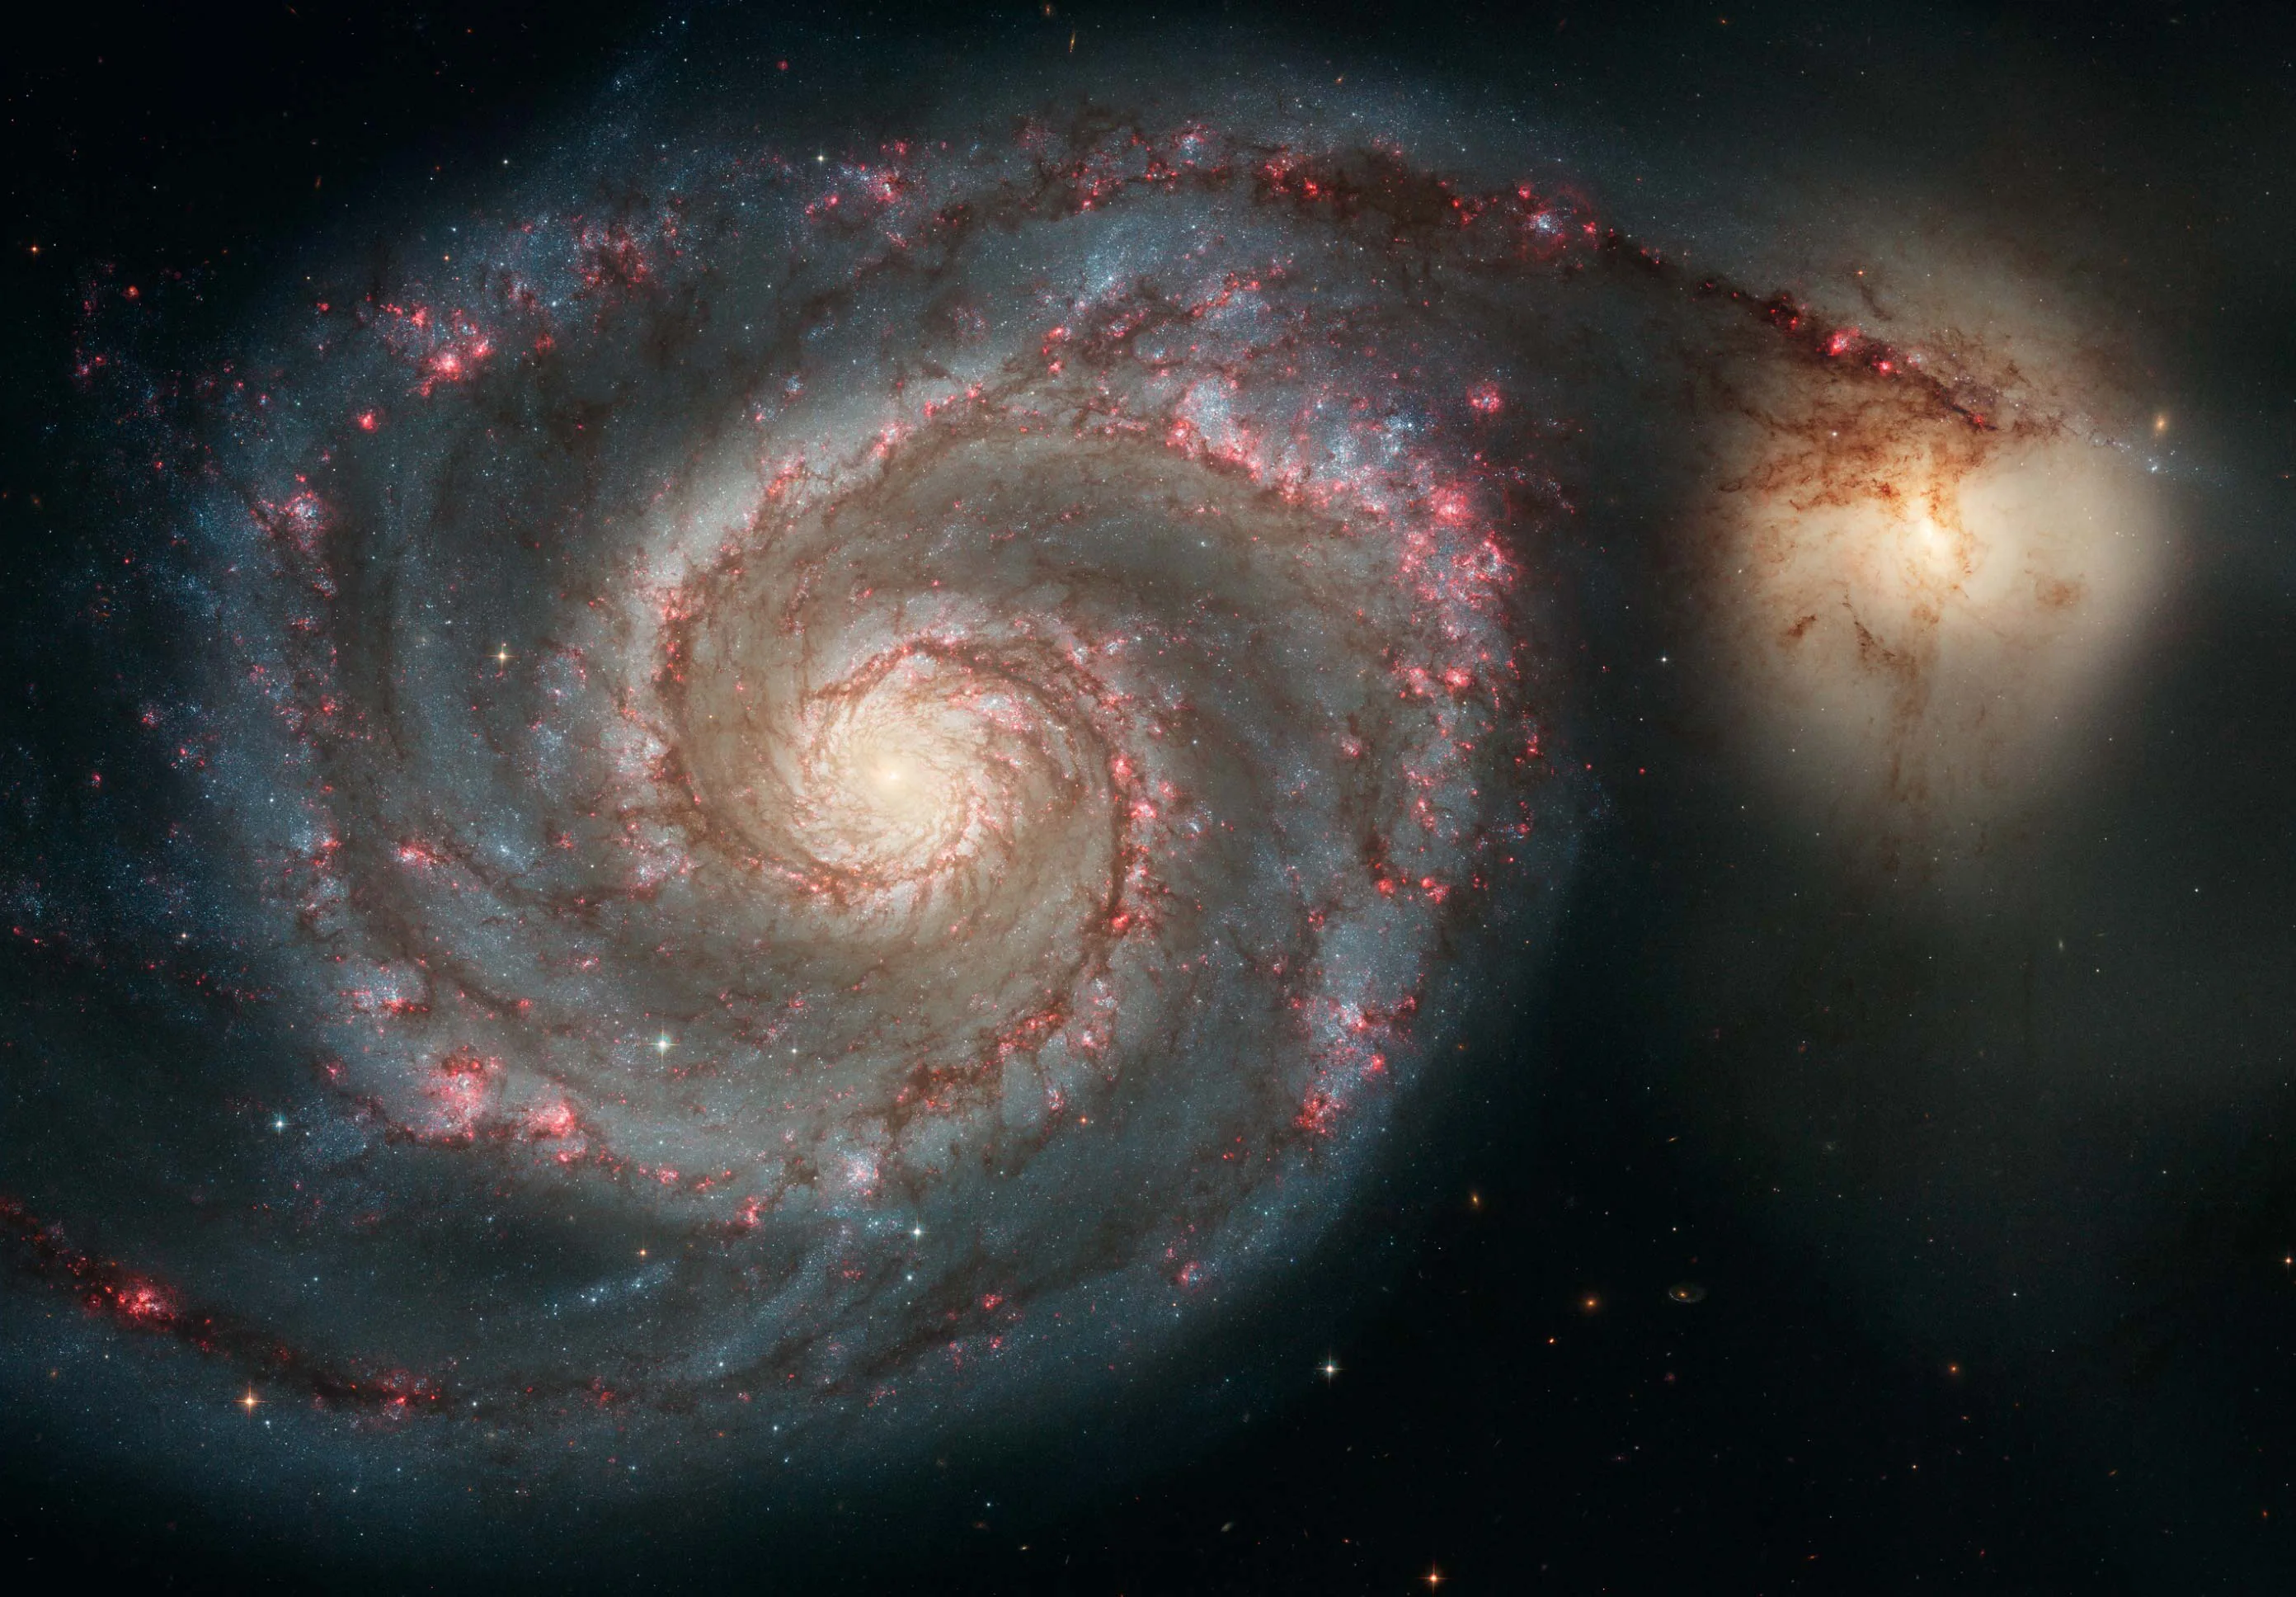
The above is a deep field image taken by the Hubble Space Telescope (HST) in which is shown vast numbers of galaxies. By current count it is estimated that the Universe contains around 2 trillion galaxies with, on average, each galaxy containing around 100 billion stars.
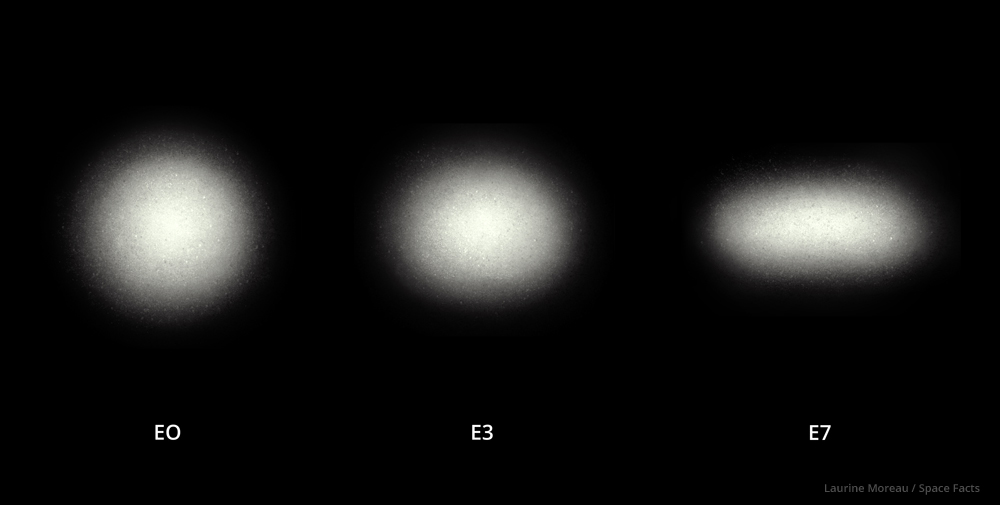
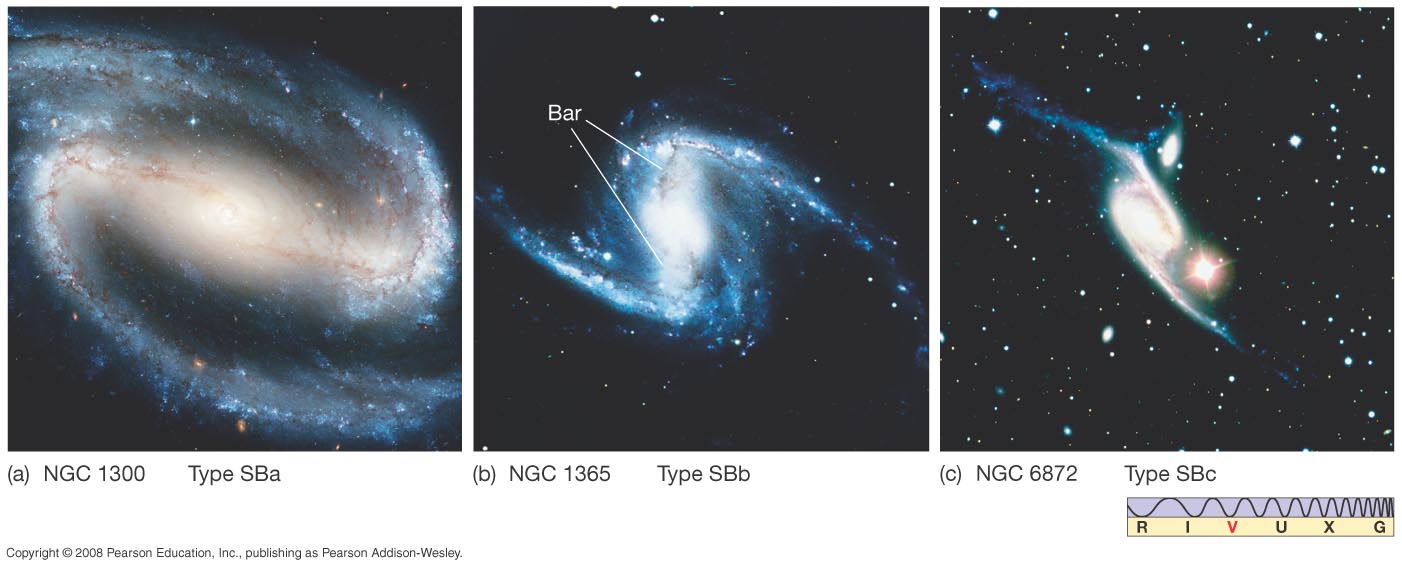
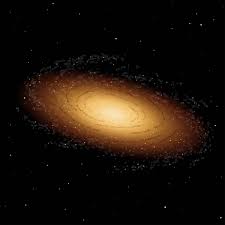
Galaxies are divided up into different types. There are Elliptical galaxies, and the disk-like galaxies which include Normal Spirals, Barred Spirals and Lenticulars which include normal S0s and barred SB0s . The galaxies were classified by Hubble forming his so-called Hubble Tuning Fork Diagram:
Dynamical methods are used to find galaxy masses (as already discussed). In dynamical methods, we rely on Newton's laws of motion and gravity. (Dynamical methods are applied on all scales -- from individual galaxies to pairs of galaxies to clusters of galaxies to clusters of clusters of galaxies and so on ... .)
|
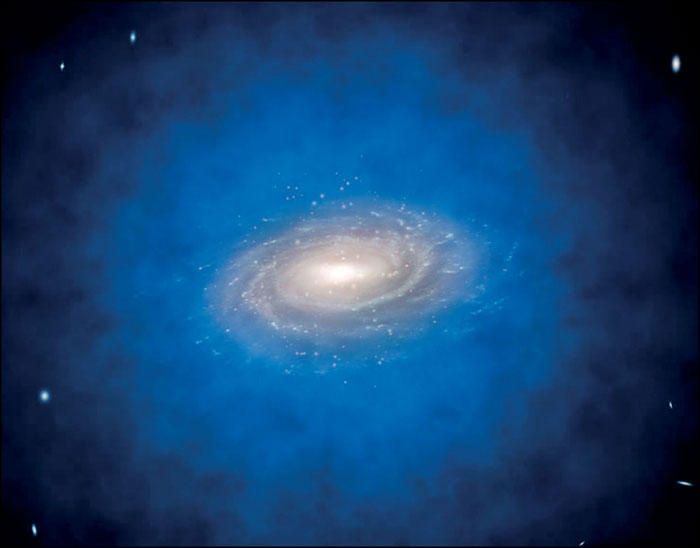
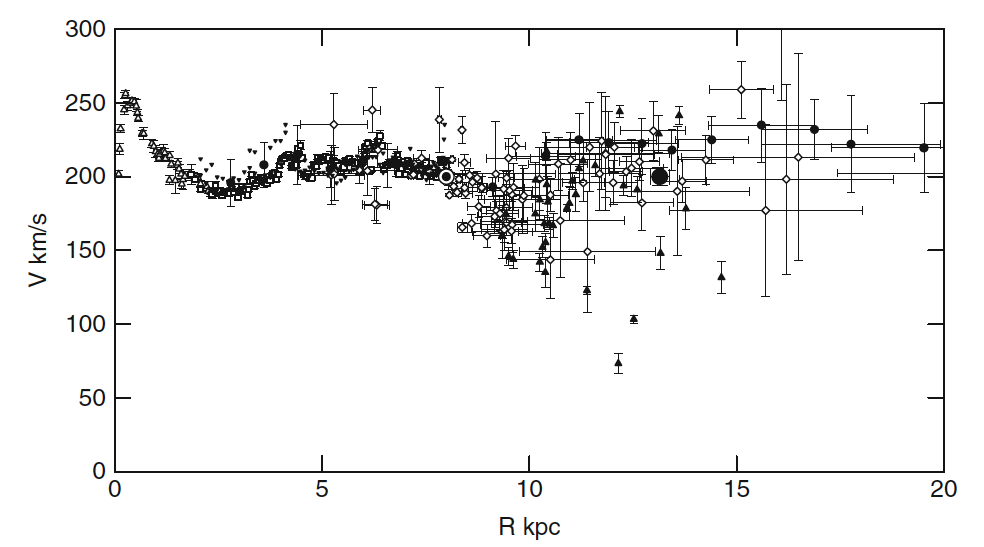
The fact that the orbital speed does not decrease indicates gravity does not weaken as quickly it does in our Solar System. This is naturally understood to mean that objects in our Galaxy have not yet moved out of the Milky Galaxy, we are still in the body of the Galaxy. The further out the rotation curve remains flat, the larger must be the Milky Way galaxy!Our galaxy has a thin disk of stars whose diameter is around 30,000 parsecs (100,000 light years) and thickness is 600 parsecs (2,000 light years). The disk is embedded in a large roughly spherical halo dominated by dark matter. The halo has a diameter of at least 100,000 parsecs based on the flat rotation curve of the Milky Way galaxy. It may be as large as 600,000 parsecs in diameter, which is just outrageous. The distance to Andromeda, M31 is around the same distance, that is, it is suggested that the Milky Way may stretch half-way to the Andromeda galaxy! |
 |
The Milky Way rotation curve is typical of other spiral galaxies. This is a nice way to measure the masses of galaxies in general ( rotation curves of some other galaxies.) The curves are all flat at large radii. Interestingly, when rotation curves are superimposed on pictures of the galaxies, we always see
Based upon studies of the rotation curves of many spiral galaxies, one is led to the same conclusion, the dark matter in the halos of the galaxies contributes at least 3 - 10 times the mass composing the luminous parts of the galaxies → Ω > 0.02 --> 0.07
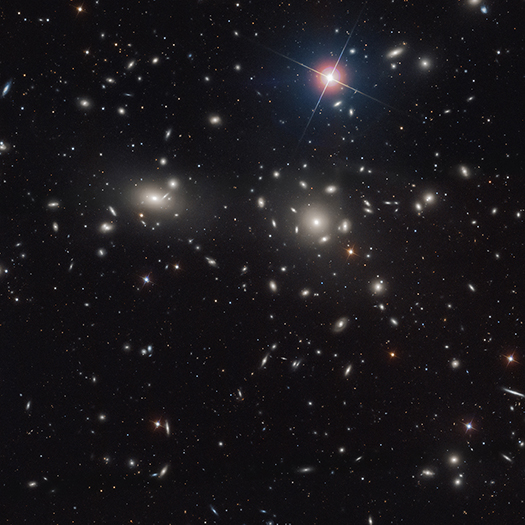
Coma Cluster rich cluster with more than 1,000 galaxies, Radius ~ 3 Mpc, Distance ~ 99 Mpc
|
It is apparent that on small scales the Universe is not isotropic and homogeneous, e.g., the Solar System is clearly lumpy. Thus, the question is On what scale does the Universe become smooth?, because it is on this scale and larger that we measure the average density of the Universe.
So far, the measurements of the mass (density) for the Universe have relied on galaxies and clusters of galaxies. Our measurements are thus local in that we measure the mass of the Universe where we can easily see mass. What are the consequences of this procedure?
Does this mean that the Universe is closed? No. The galaxy is a very overdense region of the Universe and we need to average over a larger box. The Milky Way resides in the Local Group where the large galaxies are separated by around 10 million light years. What is the density of material when smeared out over this larger volume?
ρ(Local Group) ~ 5 x 10-32 gm per c.c. << ρ(crit) as claimed!
The problem is, is the space between galaxies really empty?
clusters are separated by ~ 30 Mly (or so) → ρ(cluster of cluster) ~ 2 x 10-29 on the order of ρ(crit).
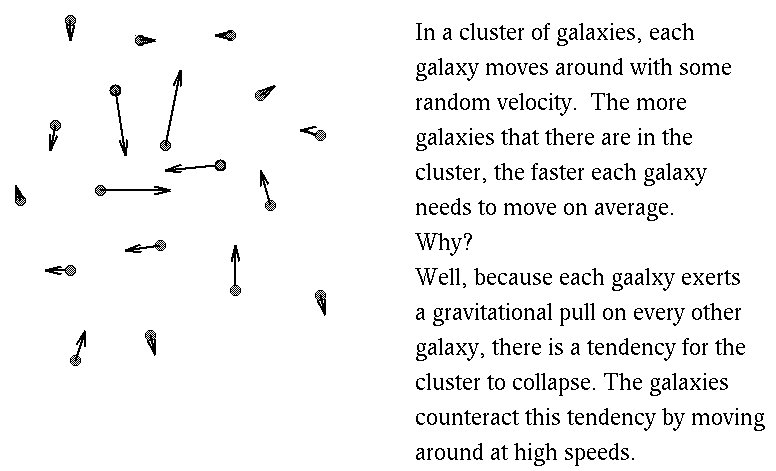
| The overall Universe participates in the expansion, the Hubble flow, shown in the right panel. However, superimposed on the uniform expansion are smaller scale motions due to interactions between galaxies, clusters of galaxies, .... . These motions are referred to as peculiar velocities, streaming motions, ... . This is shown as the internal motions of the galaxies in the figure. |
The significance of the peculiar velocities is that in order for them to have persisted over the lifetime of the Universe, they must be driven by something. If they were not being driven then they would have decayed away. The simplest explanation is that there are mass concentrations in the Universe which causes material to move around. For example, consider the

|
|
|
Up till now, dark matter and normal matter were only observed together (that is, they seemed to occupy the same spatial space). There was a suggestion that because of this, maybe dark matter was not actually real but the need for dark matter arose because there was something we did not understand about how gravity worked. It has then proposed that maybe we needed to modify gravity, and something called MOdified Newtonian Dynamics (MOND) was developed to explain all of the observed effects.
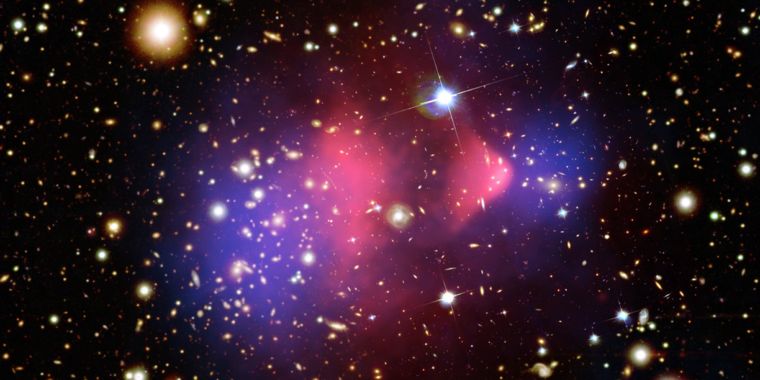 DARK MATTER is REAL |
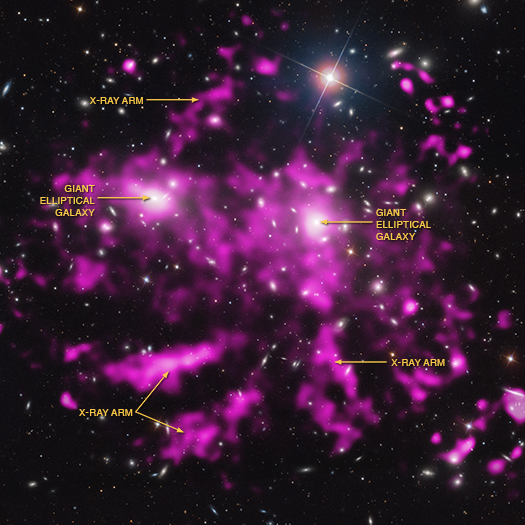
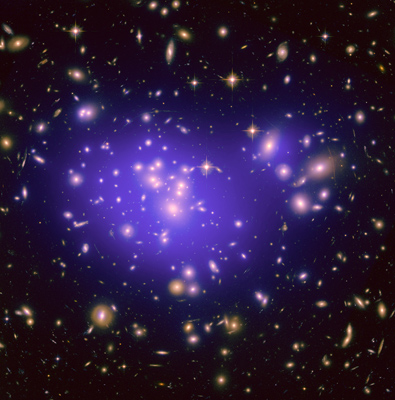
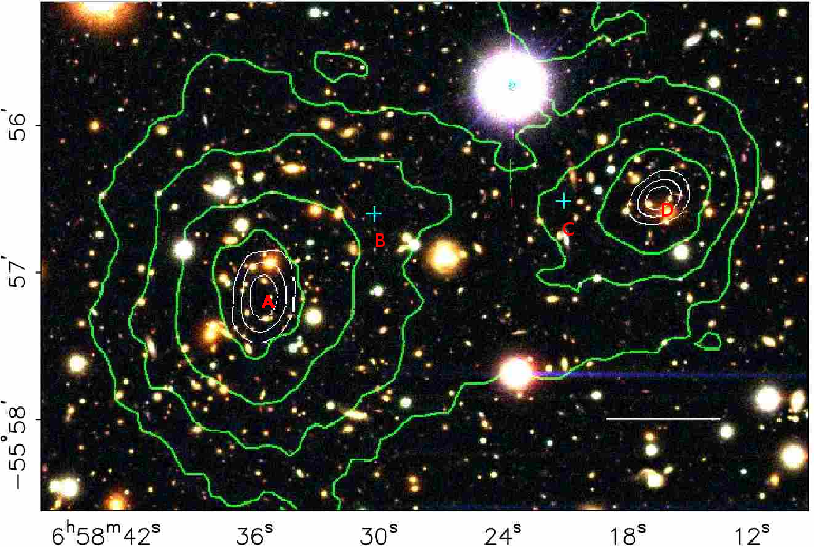
What is the Dark Matter? Due to the curvature of space caused by concentrations of mass, light-rays bend as they pass by stars, galaxies, cluster of galaxies, ... . The bending makes masses act like lenses. The above image is based on the gravitational lensing of objects behind the bullet cluster. The works shows where the mass is concentrated; it is clearly not where the x-rays are produced. |
Is our Dark Matter Halo Normal (baryonic) Matter?
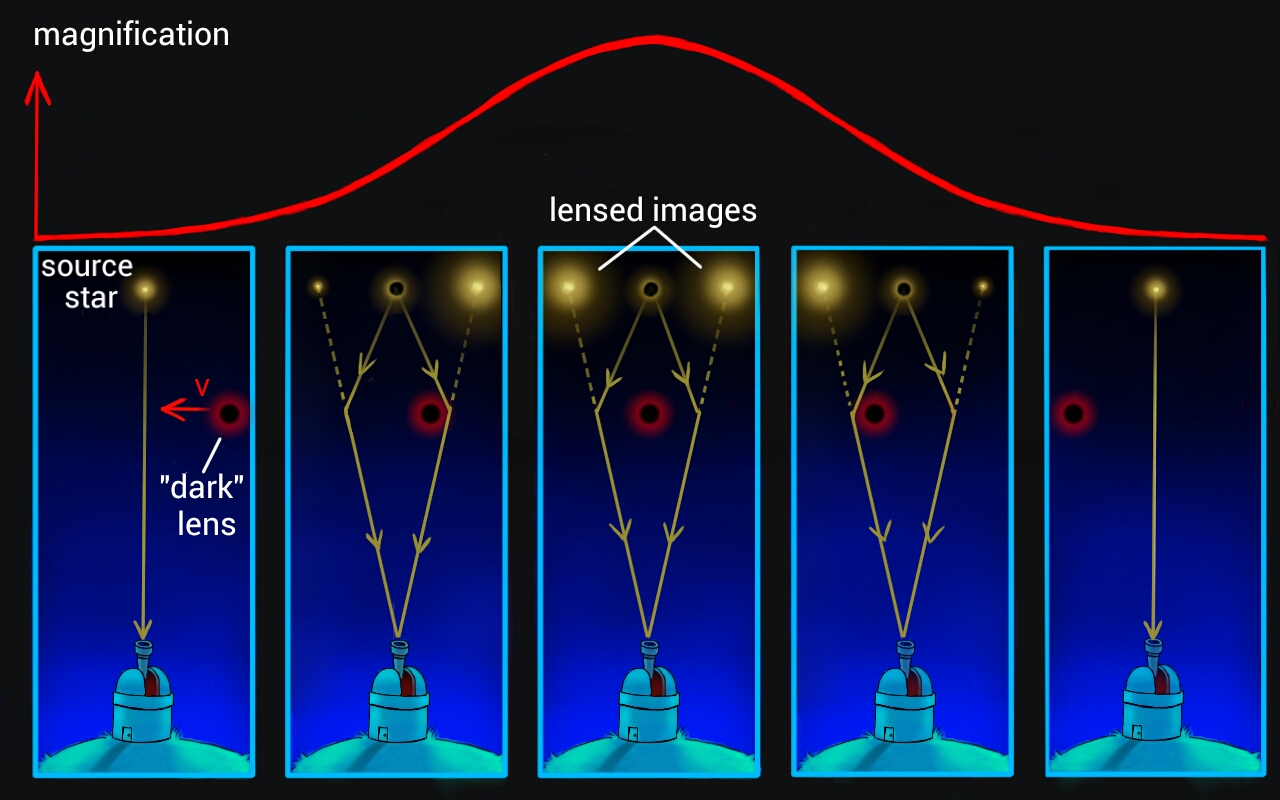
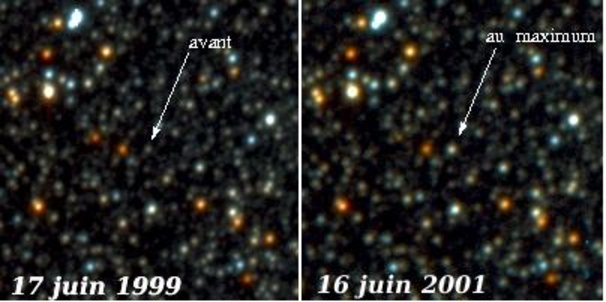
MAssive Compact HAlo Objects (MACHO), EROS, and OGLE. Experiments which viewed the Magellanic clouds to search for MACHOs in the galactic halo. Used gravitational lensing to search for MACHOs. Looked for stellar-like objects that did not radiate strongly, objects like small black holes, planets, rocks, and other compressed objects, not smoothly distributed particles. |
MACHO, EROS, and OGLE each observed events, however, results were not
consistent. MACHO found that perhaps 16 % of the halo were MACHOS, but
OGLE and EROS were consistent with < 10-25 %, that is, consistent with 0 %.
In any event, |
 | → |
 |
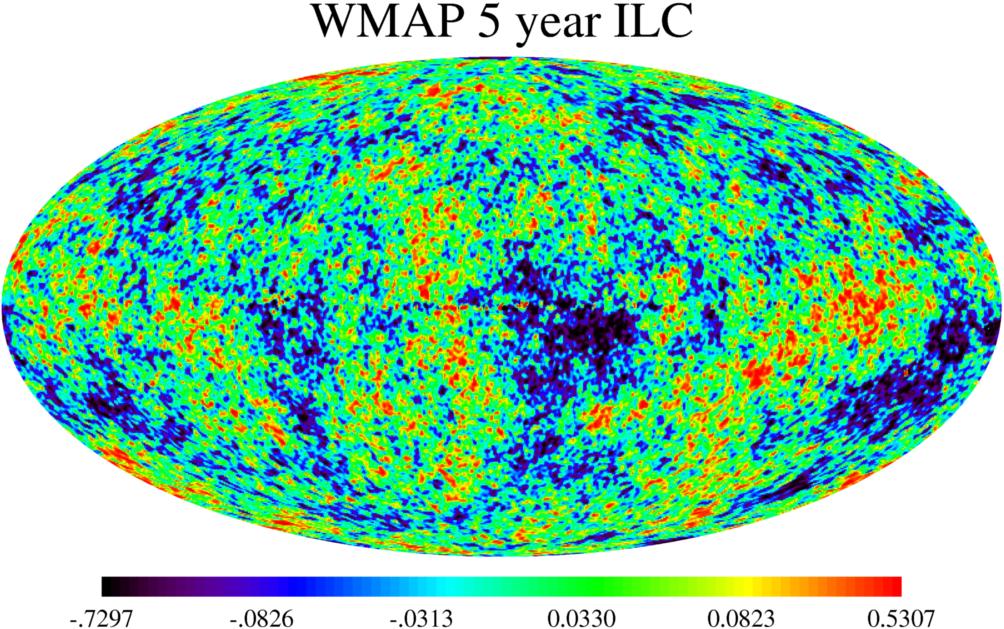
The fluctuations in the CMB at recombination eventually develop into
the structure we see in the Universe today. The development of the structure is
driven by gravity and may be modeled with a fair degree of confidence. We can
thus pin down how large must be the fluctuations in the CMB. The fluctuations
of the CMB have their origin much earlier in the Universe's history and are
for the most part are DARK MATTER fluctuations. Modeling suggests that the
properties of the DARK MATTER must be that they are
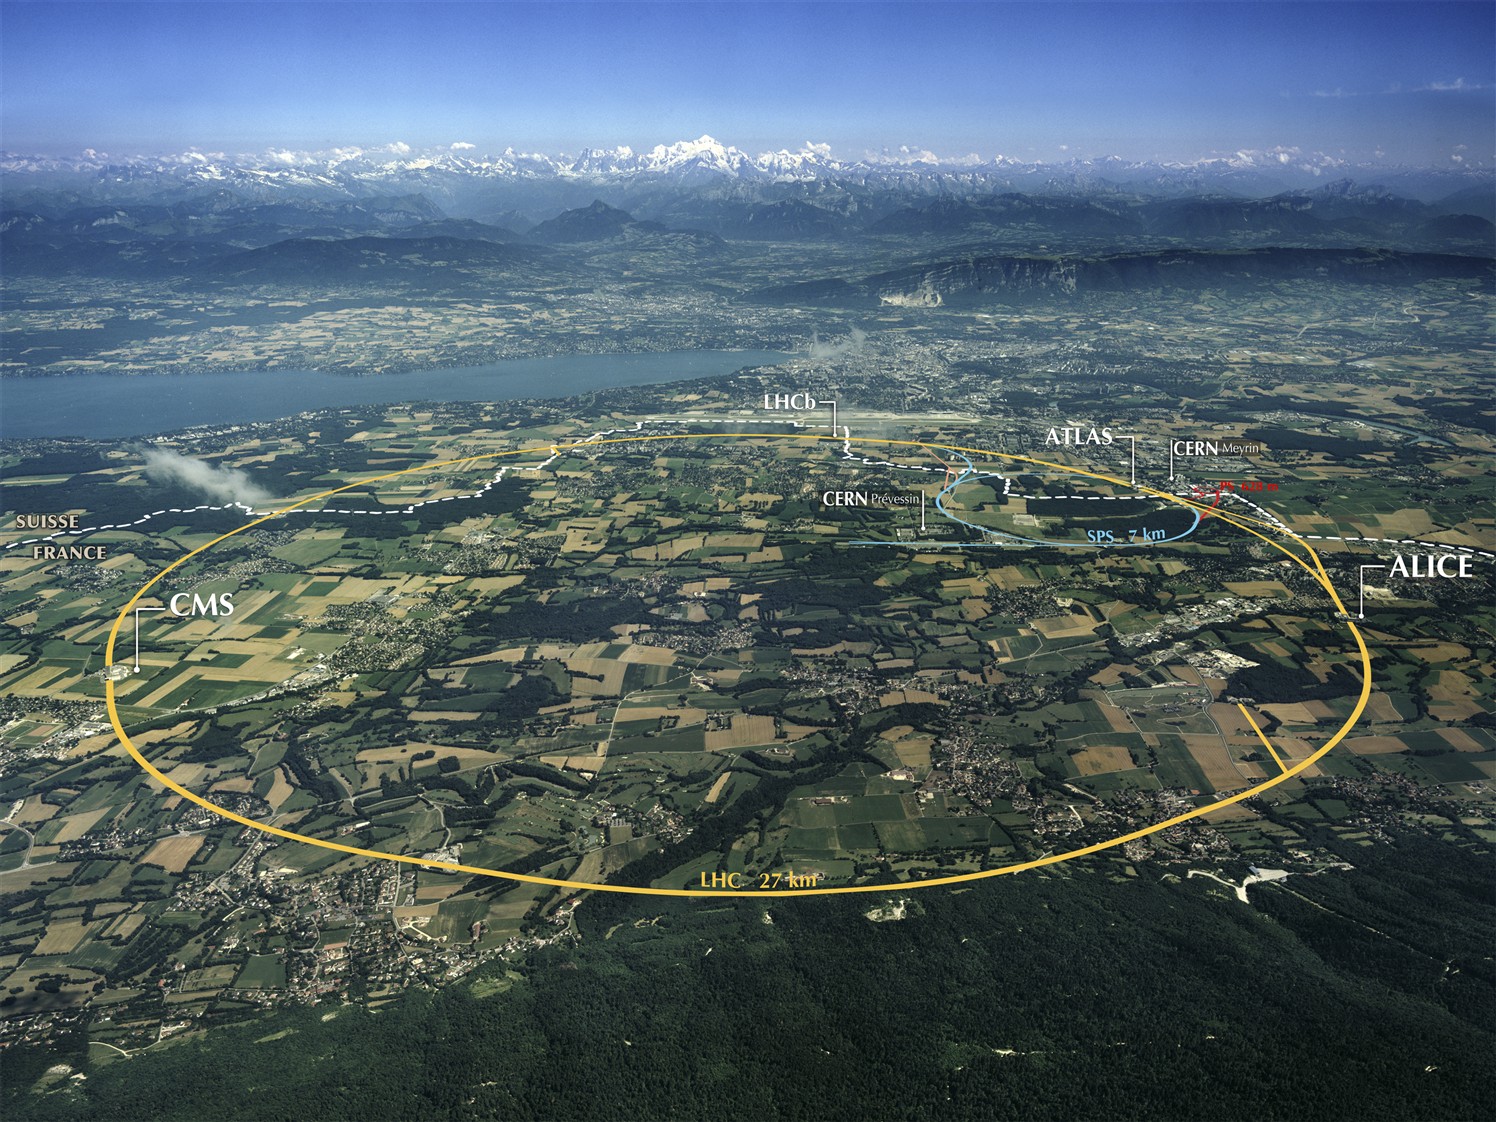
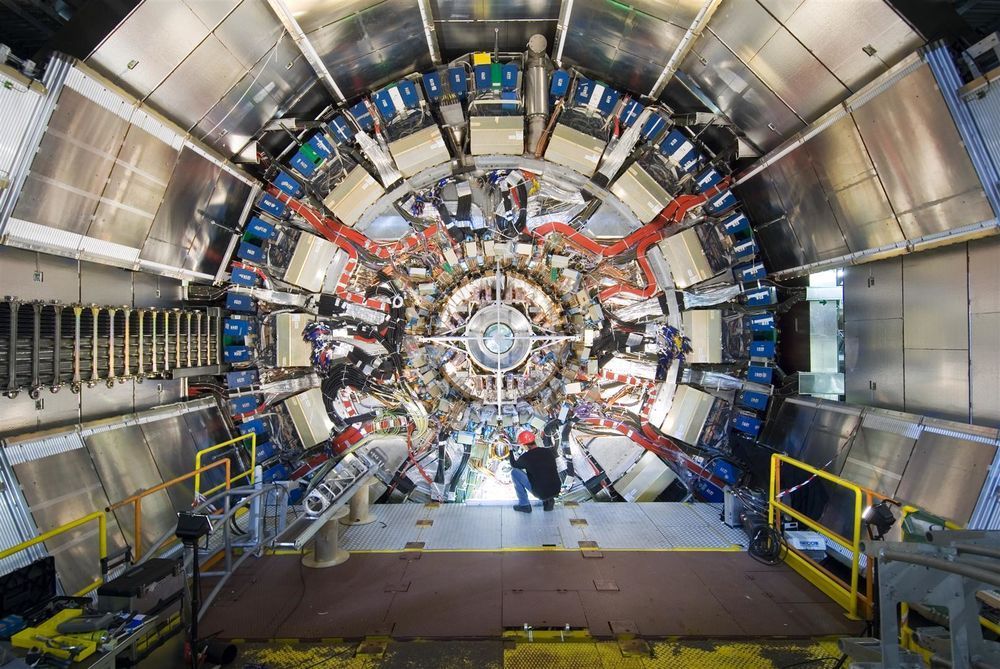
We know how DARK MATTER behaves, the trick is to find a particle which exhibits these properties. The search is an active research field in particle physics involoving theorists as well as experimentalists at the largest acclerators in the world, for example, the LHC at CERN, the European accelerator laboratory,