
|
Tying Things Together:
Hertzsprung-Russell Diagram, Mass-Luminosity Relation, Mass-Radius Relation,
Luminosity Function
|
Hertzsprung-Russell Diagram
We know masses, radii, luminosities, surface temperatures, colors,
distances, spectra, ... of many stars.
Question:
How do we make sense of the plethora of available data?
The first step
is to graph the data.
The reason we go
through this exercise is because plots can indicate
whether properties of different stars are correlated, that is, if there
is seems to be a physical
relationship (connection) between the different properties.
H-R Diagram
In the early 1900's, Ejnar Herstzprung and Henry Norris Russell
independently made the discovery that the luminosity of a star is related to
its surface temperature. The resulting plot
is amazing.
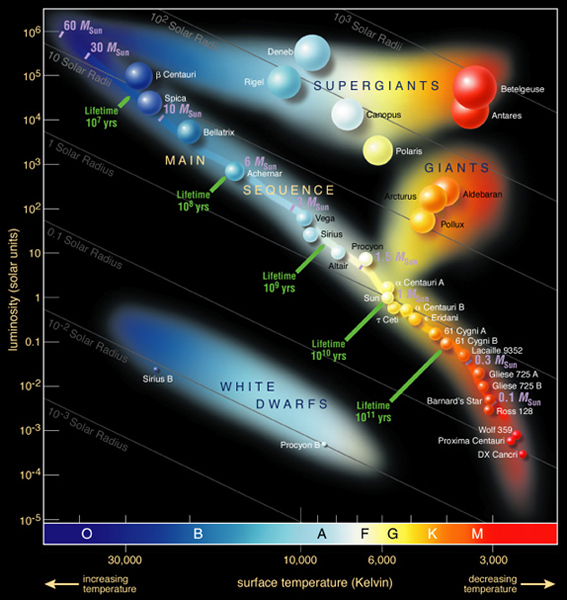
A Hertzsprung-Russell diagram (compiled primarily from Hipparcos data)
is shown to the right.
A Hertzsprung-Russell diagram for the old cluster M55
(Mochejska & Kaluzny, see APOD, 2001 Feb 23) is the top panel
on this page. The Hertzsprung-Russell (HR) diagram
was one of the most
important astronomical discoveries of the twentieth century.
Hertzsprung and Russell used the spectral class
(which is related to the surface temperature
and color of the star [which is related
to B-V]) and the magnitude in the V band (or B band)
in their plots. They
ordered the stars as O, B, A, F, G, K, and M. Since
O stars are the hottest stars, this means that
the temperature axis in the HR diagram
is odd in that the temperature decreases as one
moves to the right. The veritcal axis is the luminosity of the star, it
increases upward. The axis is in magnitudes and so is
logarithmic (mimicing the human eye).
|
|
Stars are confined to
specific regions in the HR diagram.
This tells you that
there is some physical relationship between the luminosity and
temperature of a star. To make this point clear, let's look
at people. People have many defining characteristics, not all of
which are related. What if we plotted some
properties of people? Consider, a
- plot of weight versus IQ. It will be a scatter diagram ===>
there isn't a physical relationship between weight and IQ.
- A plot of weight versus height for a sample of people shows a
correlation
===> that there is something in the
structure of people which makes weight and height correlated.
The simple exercise of plotting teaches us something about people. We
did not learn in detail how people are put together but we did
learn that the
height and weight of people are somehow related. It is
up to theorists to explain the how and why of the physical
connection between the height and weight of the people
population.
Similarly, the HR diagram is not
telling us about how stars are put together. It is,
again, up to the theorists to tell us what is going on.
However, for now, let's ignore the role of the theorist and
just examine the HR diagram to see
what we can deduce about stars.
Some Inferences Based on the Hertzsprung-Russell Diagram
|
Luminosity Classes
I -- Super-Giants
II -- Bright Giants
III -- Normal Giants
IV -- Sub-Giants
V -- Main Sequence Stars
|
Question: What can we deduce from the HR diagram?
-
Address the names of the different groupings of
stars, i.e.,, Main Sequence, Giants, Super-Giants,, and White
Dwarfs. (By the way, these groups are also referred to as Luminosity
Classes). Without having
actually measured the radii of all of these stars,
How did I know that the stars in the upper right hand corner
of the diagram were big, while the stars in the lower left hand corner were
small?
(from Stefan-Blotzmann Law)
- In a random sample of stars, roughly 85-90 % of the stars fall
along the Main Sequence and the bulk of the other stars are
White Dwarfs or Giants.
- In a cluster of stars (e.g., M55), we see the following HR diagram:
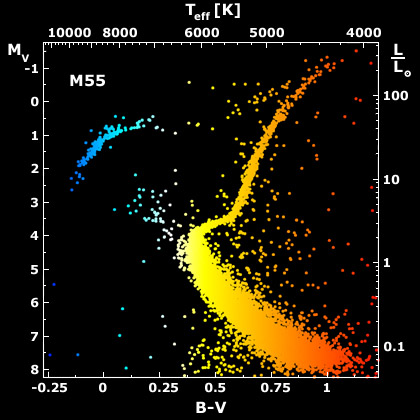
Question: What is this be telling us about
stellar evolution?
| Luminosity Function
Even along the Main Sequence, stars are not
distributed smoothly. There are many more low luminosity stars than
there are high luminosity stars. A plot of this
distribution is referred to as the
Luminosity Function.
The plot is for the Solar Neighborhood, but it is representative
of stars in our Galaxy. Note that for stars the luminosity of our Sun, that
there is around 1 stars every 1,000 cubic parsecs. That is, there is
one Sun-like star in every
cube whose sides are 10 pc long. Sun-like tars are roughly 10 parsec apart
(30 light years) in the Solar Neighborhood. The number of stars increases
strongly with decreasing luminosity. We find stars around 1 % the luminosity
of the Sun, are separated by distances of around 1 parsec (3.3 light years).
|
 |
Mass-Luminosity Relation for Main Sequence Stars
When we consider Main Sequence
stars, is there any hint about
whether an individual star evolves along the
Main Sequence or
whether a star once on the Main Sequence
does not change its
position? We believe that stars do not move
along the Main Sequence. That is, Main Sequence
stars with particular
L have the same properties. This can be seen from the
Mass-Luminosity relationship for Main
Sequence stars.
|
 |
Mass-Radius Relation for Main Sequence Stars
Radii of
Main Sequence
stars depend only weakly on mass.
Although stars do not move
along the Main Sequence, the mass-radius relation becomes uncertain because
stars evolve even when on the Main Sqauence.
We see this from the
Mass-Radius relationship for Main
Sequence stars.
|