Introduction
The determination of the location of our Sun in the Milky Way galaxy and the size of the Milky Way rested on the determination of the distances to the markers used to map the Galaxy. In order to determine the distances to observed objects one must have an independent method by which to estimate their true brightnesses (intrinsic power outputs, that is, their luminosities). Shapley in his study used the pulsating variable stars known as RR Lyrae stars taking advantage of the relationship between the period of variation and the intrinsic brightness of RR Lyrae stars and Cepheid variables discovered by Henrietta Leavitt of the Harvard Astronomical Observatory.
Stars such as Cepheids and RR Lyrae stars that vary regularly in their outputs are called variable stars. A variable star is unable to find the proper balance between the energy welling up in its nuclear furnace in its core and the power radiated from its surface. Initially as energy is released in its core, the star is compact and is unable to radiate the energy and heats. This forces the internal pressure in the star to build up causing it to expand in size. The expansion puffs up outer layers of the star allowing the heat to leak out allowing the star to release some of the pressure built up. The pressure then drops, and the star contracts. In this effort to find a steady equilibrium, the atmospheres of pulsating variable stars alternately expand and contract, causing the star's luminosity to rise and fall. The figure below shows a typical plot of the output of such a star as a function of time (the star's light curve),
The period between peaks in luminosity is easily mesured from a light curve. These periods range from as short as several hours to as long as several months. Cepheids vary in output with periods of a few days to a few months.
Once the period of a Cepheid variable is determined, the period-luminosity relation yields its power output (its luminosity) and its distance may then be found using its obseved brightness. Cepheid measurements provide distances to nearby galaxies and calibrate the Tully-Fisher relation.
1. We will first construct a period-luminosity relation based on the following table of Cepheid periods, distances, and luminosities. Note--for historical reasons the luminosity (POWER) of Celestial Objects is based on something known as the magnitude system (Section 17.2 and the box More Precisely 17-1 in the text) which has its origins with the Greeks. The magnitude system is a logarithmic measure of the luminosity of an object given by
Magnitudes are defined so that the brighter is an object the more negative is its Magnitude. Rewriting the definition for M, we find
Plot the Absolute Magnitudes of the Cepheids versus their periods of variation. We will later convert to luminosities (if needed). Use the following Cepheids and this sheet of log-linear graph paper. Comment: Print the graph paper and then rotate it 90o in the clockwise direction to make the plot. Note that the logarithmic scale is marked on the top of the graph paper (after you rotate the sheet by 90o). The scale on the horizontal axis (the logarithmic axis) runs from Period = 1 day to 1,000 days. Relabel the vertical axis (the linear axis) to run from M = 0 to M = -10.
Name | P(days) | Absolute Magnitude, M |
U Aql | 7 | -3.66 |
SZ Aql | 17.1 | -4.78 |
TT Aql | 13.8 | -4.51 |
FF Aql | 4.5 | -3.55 |
FM Aql | 6.1 | -3.48 |
FN Aql | 9.5 | -4.04 |
IU Aql | 22 | -5.1 |
V493 Aql | 3 | -2.58 |
V496 Aql | 6.8 | -3.62 |
V526 Aql | 4.2 | -3.02 |
V800 Aql | 20.1 | -4.98 |
V1162 Aql | 5.4 | -3.32 |
V340 Ara | 20.8 | -5.03 |
V475 Ara | 1.5 | -1.72 |
RX Aur | 11.6 | -4.29 |
SY Aur | 10.1 | -4.12 |
YZ Aur | 18.2 | -4.86 |
FF Aur | 2.1 | -2.15 |
AD Cam | 11.3 | -4.25 |
SS Cma | 12.4 | -4.37 |
VY Car | 18.9 | -4.91 |
WZ Car | 23 | -5.16 |
YZ Car | 18.2 | -4.86 |
KN Cen | 34 | -5.65 |
CP Cep | 17.9 | -4.84 |
VX Cyg | 20.1 | -4.99 |
V396 Cyg | 33.2 | -5.62 |
V609 Cyg | 31.1 | -5.53 |
T Mon | 27 | -5.36 |
X Pup | 26 | -5.31 |
RS Pup | 41.4 | -6.09 |
NGC 300-3 | 83 | -7.42 |
NGC 300-2 | 89.1 | -6.97 |
SMC HV829 | 84.4 | -7.25 |
NGC 55-4 | 97.7 | -6.31 |
LMC HV5497 | 98.6 | -7.03 |
LMC HV2883 | 109 | -6.54 |
NGC 55-3 | 113 | -6.67 |
2. Draw a line through your plotted points to indicate roughly how the Absolute magnitude of a Cepheid depends upon its period of variation. The trend of the plot says that Cepheids with (LONGER/SHORTER) periods of pulsation have (GREATER/SMALLER) intrinsic luminosities. Compare the luminosities of two Cepheids, one with period = 5 days and one with 10 days.
3. The galaxy M100 contains Cepheids which help us to determine the distance to M100,
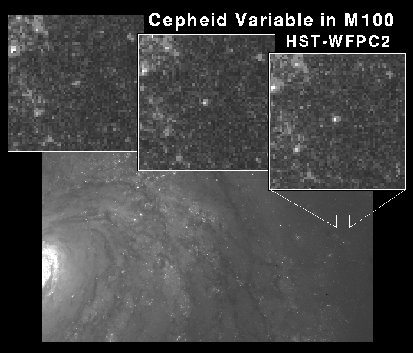 | 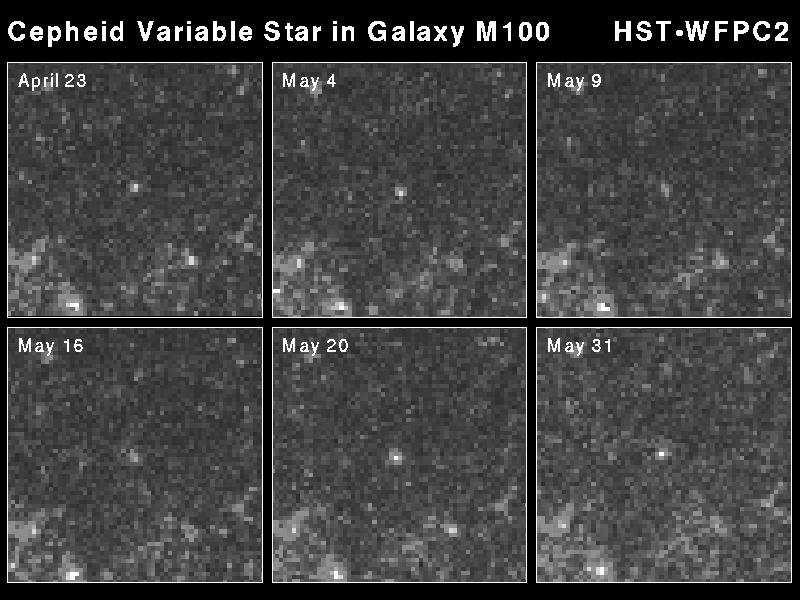 |
The images were taken with NASA's Hubble Space Telescope of the spiral galaxy M100. The images were taken in visible light in 1994. The Cepheid in the picture doubles in brightness (24.5 to 25.3 apparent magnitude, m) over a period of 51.3 days. What then is its total period of variation? Use this period to find the absolute magnitude M of the Cepheid from your period-luminosity relation.
4. Then using the average apparent magnitude m and M, find the distance to M100 by use of the relation given in the box More Precisely 17-1, page 458 in the text,