| Readings: |
Cosmic
Microwave Background |
Cosmic Background Radiation :
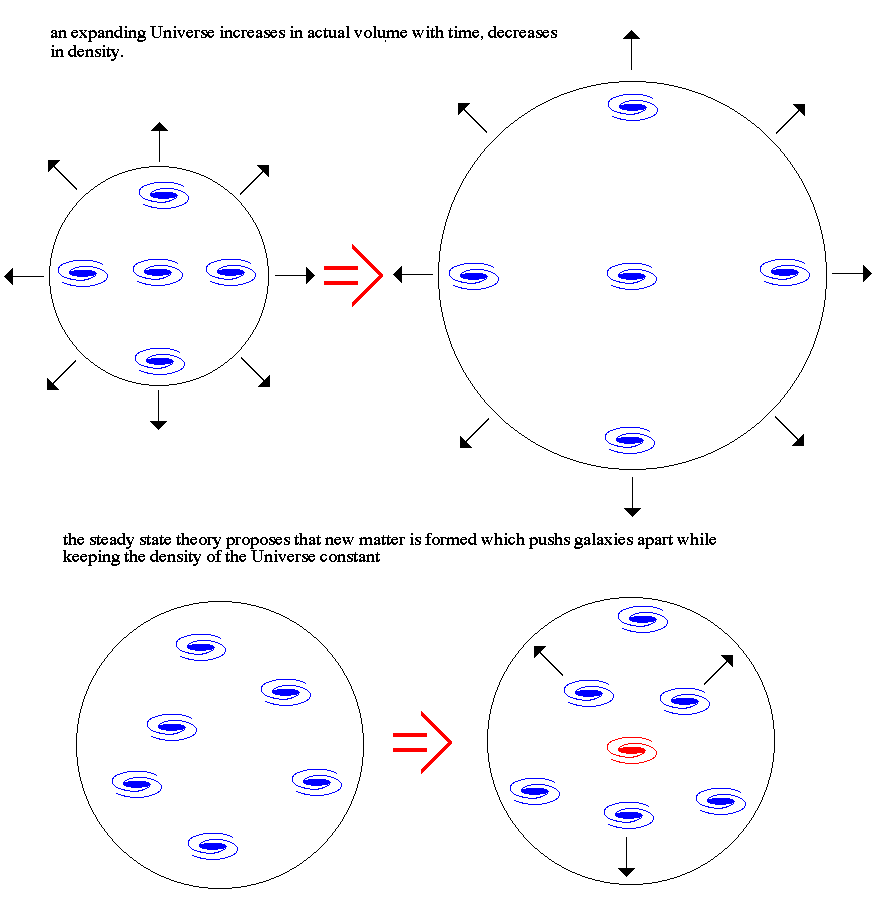
One of the foremost cosmological discoveries was the detection of the cosmic background radiation. The discovery of an expanding Universe by Hubble was critical to our understanding of the origin of the Universe, known as the Big Bang. However, a dynamic Universe can also be explained by the steady state theory.
The steady state theory avoids the idea of Creation by assuming that the Universe has been expanding forever. Since this would mean that the density of the Universe would get smaller and smaller with each passing year (and surveys of galaxies out to distant volumes shows this is not the case), the steady-state theory requires that new matter be produced to keep the density constant.

The creation of new matter would violate the conservation of matter principle, but the amount needed would only be one atom per cubic meter per 100 years to match the expansion rate given by Hubble's constant.
The discovery of the cosmic microwave background (CMB) confirmed the explosive nature to the origin of our Universe. For every matter particle in the Universe there are 10 billion more photons. This is the baryon number that reflects the asymmetry between matter and anti-matter in the early Universe. Looking around the Universe its obvious that there is a great deal of matter. By the same token, there are even many, many more photons from the initial annihilation of matter and anti-matter.
Most of the photons that you see with your naked eye at night come from the centers of stars. Photons created by nuclear fusion at the cores of stars then scatter their way out from a star's center to its surface, to shine in the night sky. But these photons only make up a very small fraction of the total number of photons in the Universe. Most photons in the Universe are cosmic background radiation, invisible to the eye.
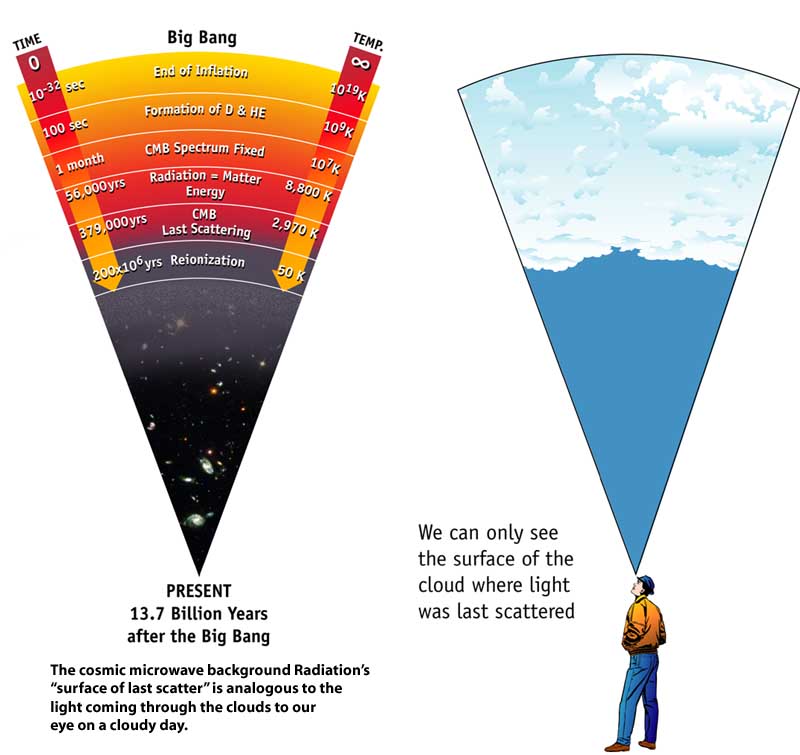
Cosmic background photons have their origin at the matter/anti-matter annihilation era and, thus, were formed as gamma-rays. But, since then, they have found themselves scattering off particles during the radiation era. At recombination, these cosmic background photons escaped from the interaction with matter to travel freely through the Universe.
As the Universe continued to expanded over the last 15 billion years, these cosmic background photons also `expanded', meaning their wavelengths increased. The original gamma-ray energies of cosmic background photons has since cooled to microwave wavelengths. Thus, this microwave radiation that we see today is an `echo' of the Big Bang.

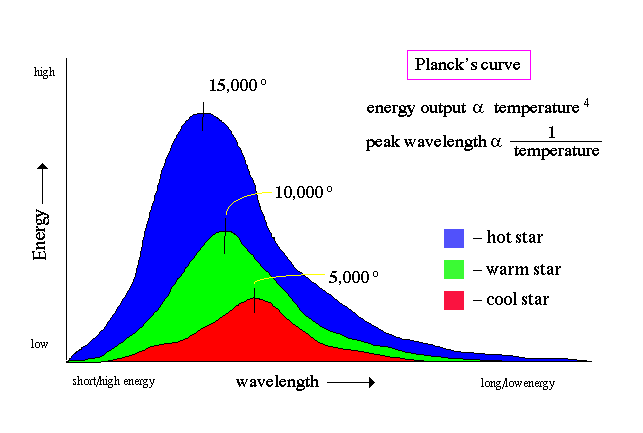
The discovery of the cosmic microwave background (CMB) in the early 1960's was powerful confirmation of the Big Bang theory. Since the time of recombination, cosmic background photons have been free to travel uninhibited by interactions with matter. Thus, we expect their distribution of energy to be a perfect blackbody curve. A blackbody is the curve expected from a thermal distribution of photons, in this case from the thermalization era before recombination.
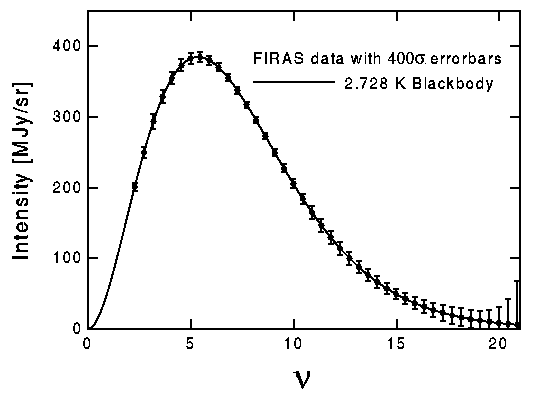
Today, based on space-based observations because the microwave region of the spectrum is blocked by the Earth's atmosphere, we have an accurate map of the CMB's energy curve. The peak of the curve represents the mean temperature of the CMB, 2.7 degrees about absolute zero, the temperature the Universe has dropped to 15 billion years after the Big Bang.
Where are the CMB photons at the moment? The answer is `all around you'. CMB photons fill the Universe, and this lecture hall, but their energies are so weak after 15 billion years that they are difficult to detect without very sensitive microwave antennas.
CMB Fluctuations :
The CMB is highly isotropy, uniform to better than 1 part in 100,000. Any deviations from uniformity are measuring the fluctuations that grew by gravitational instability into galaxies and clusters of galaxies.
Images of the CMB are a full sky image, meaning that it looks like a map of the Earth unfolded from a globe. In this case, the globe is the celestial sphere and we are looking at a flat map of the sphere.
Maps of the CMB have to go through three stages of analysis to reveal the fluctuations associated with the early Universe. The raw image of the sky looks like the following, where red is hotter and blue is cooler:

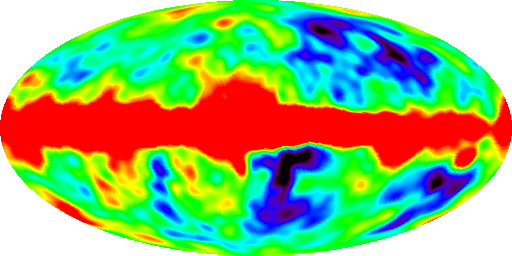
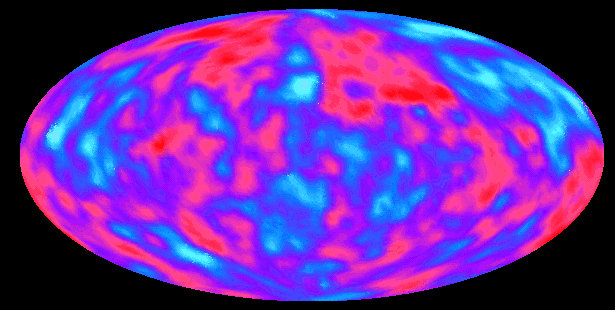
The clumpness of the CMB image is due to fluctuations in temperature of the CMB photons. Changes in temperature are due to changes in density of the gas at the moment of recombination (higher densities equal higher temperatures). Since these photons are coming to us from the last scattering epoch, they represent fluctuations in density at that time.
The origin of these fluctuations are primordial quantum fluctuations from the very earliest moments that are echo'ed in the CMB at recombination. Currently, we believe that these quantum fluctuations grew to greater than galaxy-size during the inflation epoch, and are the source of structure in the Universe.
When we look out in the sky, we're actually looking backwards in time. Light from more distant objects take longer to reach us and thus we are observing now how they appeared in the past. We can see back a few billion years with the light of galaxies. The microwave light of the background shines from long ago in an infant universe 300,000 years old (the epoch of "last scattering") and illuminates the particle soup that existed before this time. This soup has a very smooth consistency and is composed of fundamental particles like electrons, protons, helium nuclei, neutrinos.
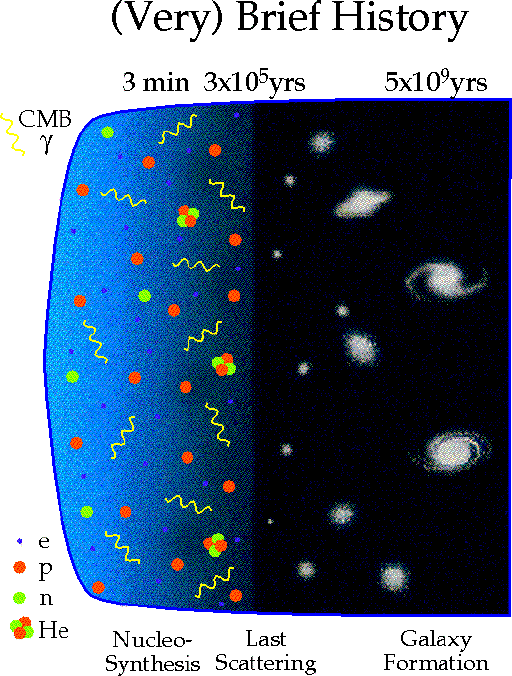
The obvious questions are: how did the universe go from a smooth particle soup to a complex system of galaxies and large scale structure. Can we use the fact that we're seeing the surface of this soup in the microwave background to help us understand this question.
If we have small wrinkles or hills and valleys early on in the universe, matter will tend to fall into the valleys, eventually producing dense regions that become the sites of galaxies.

We represent these wrinkles by a sort of "top view" where the color coding refers to the density of matter (dark regions have more matter, light regions less).

Needless to say, this is a bit of an idealization for illustrative purposes. Cosmologists actually run computer simulations to track how matter collects into valleys. For example, here is a simulation running forward in time which shows how particles collect and enhance small initially small wrinkles.

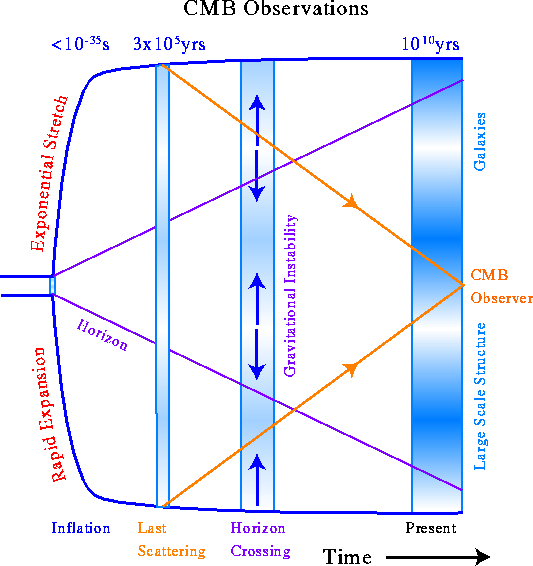
One question that remains unanswered is what is the origin of such large scale wrinkles in the first place. Inflation theory is that a period of rapid expansion takes very small scale fluctuations at the level of the particle soup and stretches them to cosmic proportions.

Here the blue bands are snapshots of the wrinkles in the density of the universe at various times. As time goes on, matter falls into these wrinkles and starts to build heavier and heavier objects. The crucial period when this process of gravitational attraction and infall can occur is related to an important concept in cosmology called the horizon. Like the horizon on the earth, it is the point beyond which we're unable to look. Unlike the earth's horizon, this distance is increasing with time because light from more distant regions has had more time to reach us. Heuristically, if there is a large clump in the universe we only know to fall toward it once it comes into the horizon.
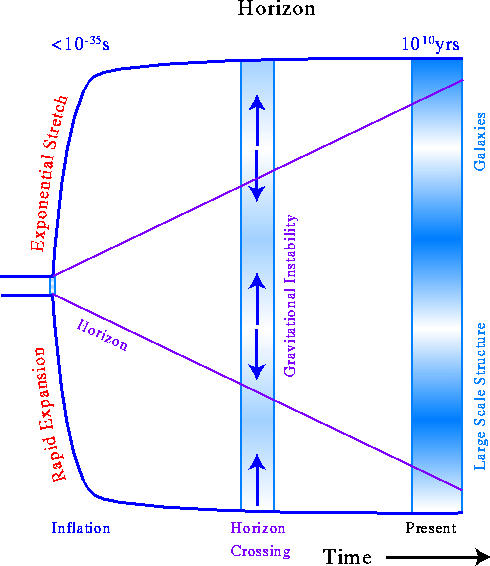
A useful property of the microwave background is that when we look out across widely separated angles, we're looking at wrinkles on such large scales that this process of infall hasn't yet begun. We're looking at the primordial wrinkles themselves.
Small variations in the temperature of the background radiation from point to point on the sky are called anisotropies. These anisotropies were first detected by the COBE (NASA's COsmic Background Explorer) satellite in 1992. The current MAP (NASA's Microwave Anisotropy Probe mission) version of the CMB is:

COBE and MAP then has told us what the large scale ripples in the background radiation temperature look like. However there is much to be gained by examining the fine details of the ripples. Recall that on the large scales, the temperature ripples reflected the primordial ripples themselves. That is because on scales that are larger than the horizon there hasn't been enough time for matter to collect in the valleys and the process of structure formation to start. When we look at smaller scales than the horizon, we see the process of structure formation at work.
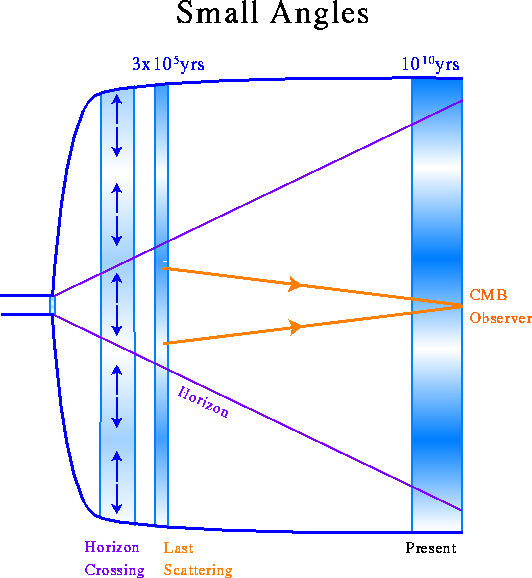
The goal of the current generation of experiments is to understand this process in detail by looking at the small scale ripples in the background radiation temperature.
What we see on small scales is actually sound. When the Universe was young, it was very density and very hot. Radiation (photons) and matter were tightly coupled, behaving as a single gas. Sound waves travel in gas, called acoustic waves. Ordinary sound waves are just traveling compressions and rarefactions of the gas which we hear as sound as they strike our ear drum. The photons also carry acoustic waves as gravity tries to compress the gas and pressure resists it. The reason why we see it rather than hear it is that when we compress the gas it becomes hotter. We see the acoustic waves as hot and cold spots on the sky.
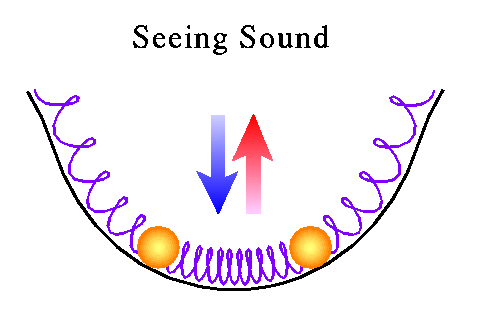
The result is a spectrum of acoustic waves that are useful in determining the origin, evolution and fate of objects in the Universe. The analogue to music is often made for the cosmic microwave background spectrum, using the language of harmonics or overtones. For example, when a musical instrument plays a note it is vibrating at what is called a fundamental mode. Various overtones for that fundamental mode exist as integer multiples of the fundamental mode (i.e., 1,2,3,4,...). The fluctuations originated from the inflation period of rapid expansion. Whether or not this actually happened can be "heard" in the microwave background. The fundamental tone of a musical system is related to its physical size - here the horizon size at last scattering.

There is also a pattern of overtones at integer multiples of the fundamental frequency.
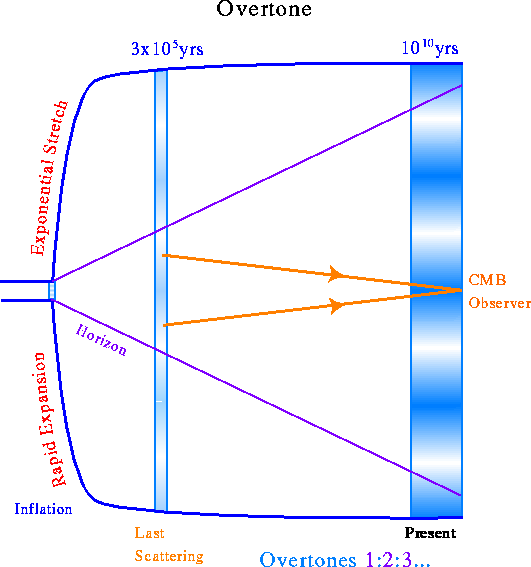
In music, the pattern of overtones helps us distinguish one instrument from another: it is a kind of signature of the instrument that makes the sound. In the same way, the pattern of overtones in the sound spectrum of the microwave background ripples acts as a signature of inflation. Inflation's signatures are that the overtones follow a pure harmonic series with frequency ratios of 1:2:3...
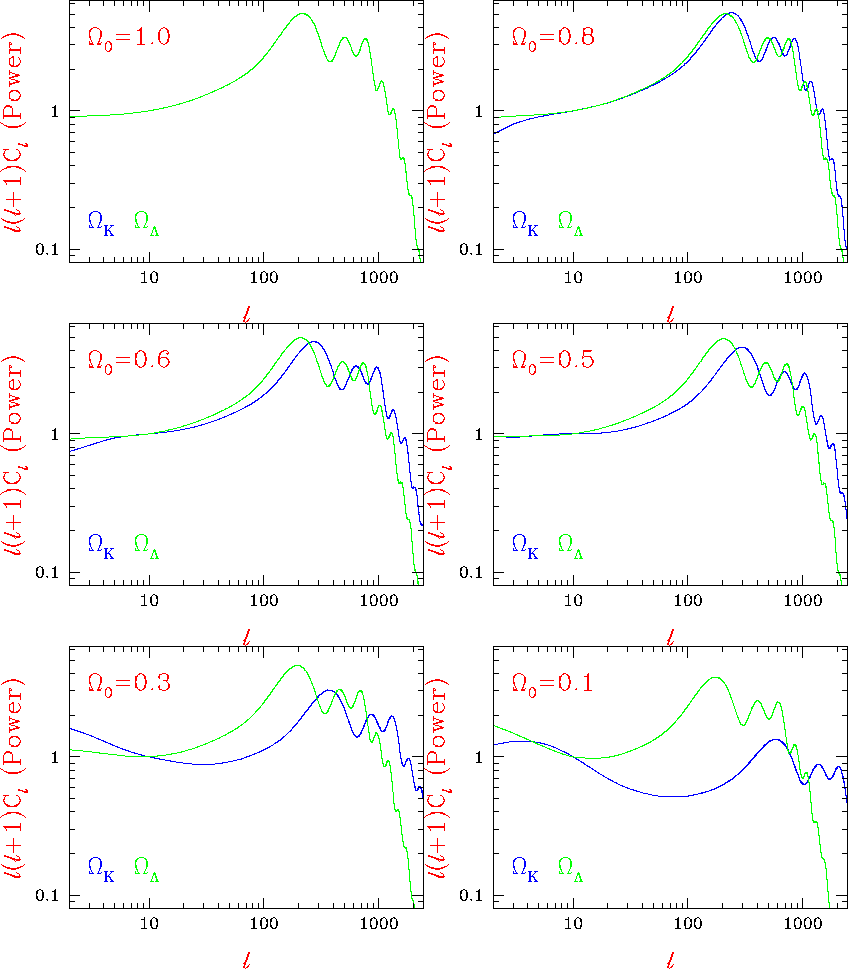
COBE told us what the large-scale fluctuations in the background look like, this would be the fundamental model, the first acoustic peak in the CMB power spectrum. If this first peak is at high wave numbers (smaller scale) then the Universe has an open geometry. If the first peak is at low wave numbers (large scale) then the Universe has a flat geometry. The plot below indicates a first peak consistent with a flat geometry.
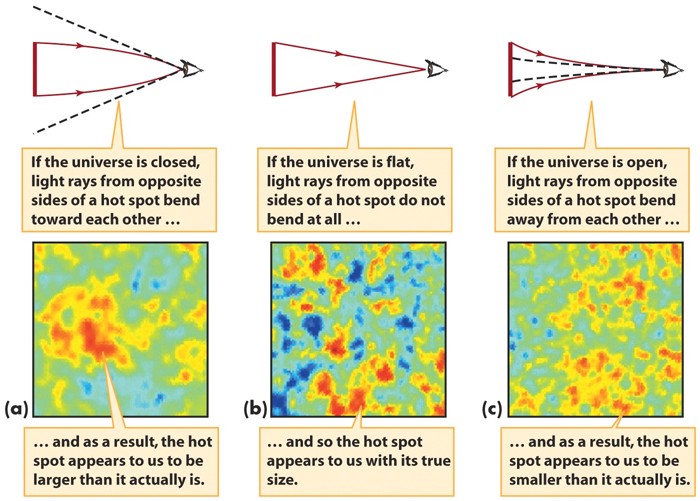
But cosmologists today are more interested in the small-scale fluctuations. For smaller scales (larger overtones) provide information on the large scale structure (clusters of galaxies called baryon loading) and galaxy formation from dissipation.
Astronomers divide up the sky into angular degrees, so that 90 degrees is the distance from the horizon to a point directly overhead. COBE measured temperature ripples from the 10 degree to 90 degree scale. This scale is so large that there has not been enough time for structures to evolve. Hence COBE sees the so-called initial conditions of the universe. At the degree scale, on the other hand, the process of structure formation imprints information in the ripples about conditions in the early universe.
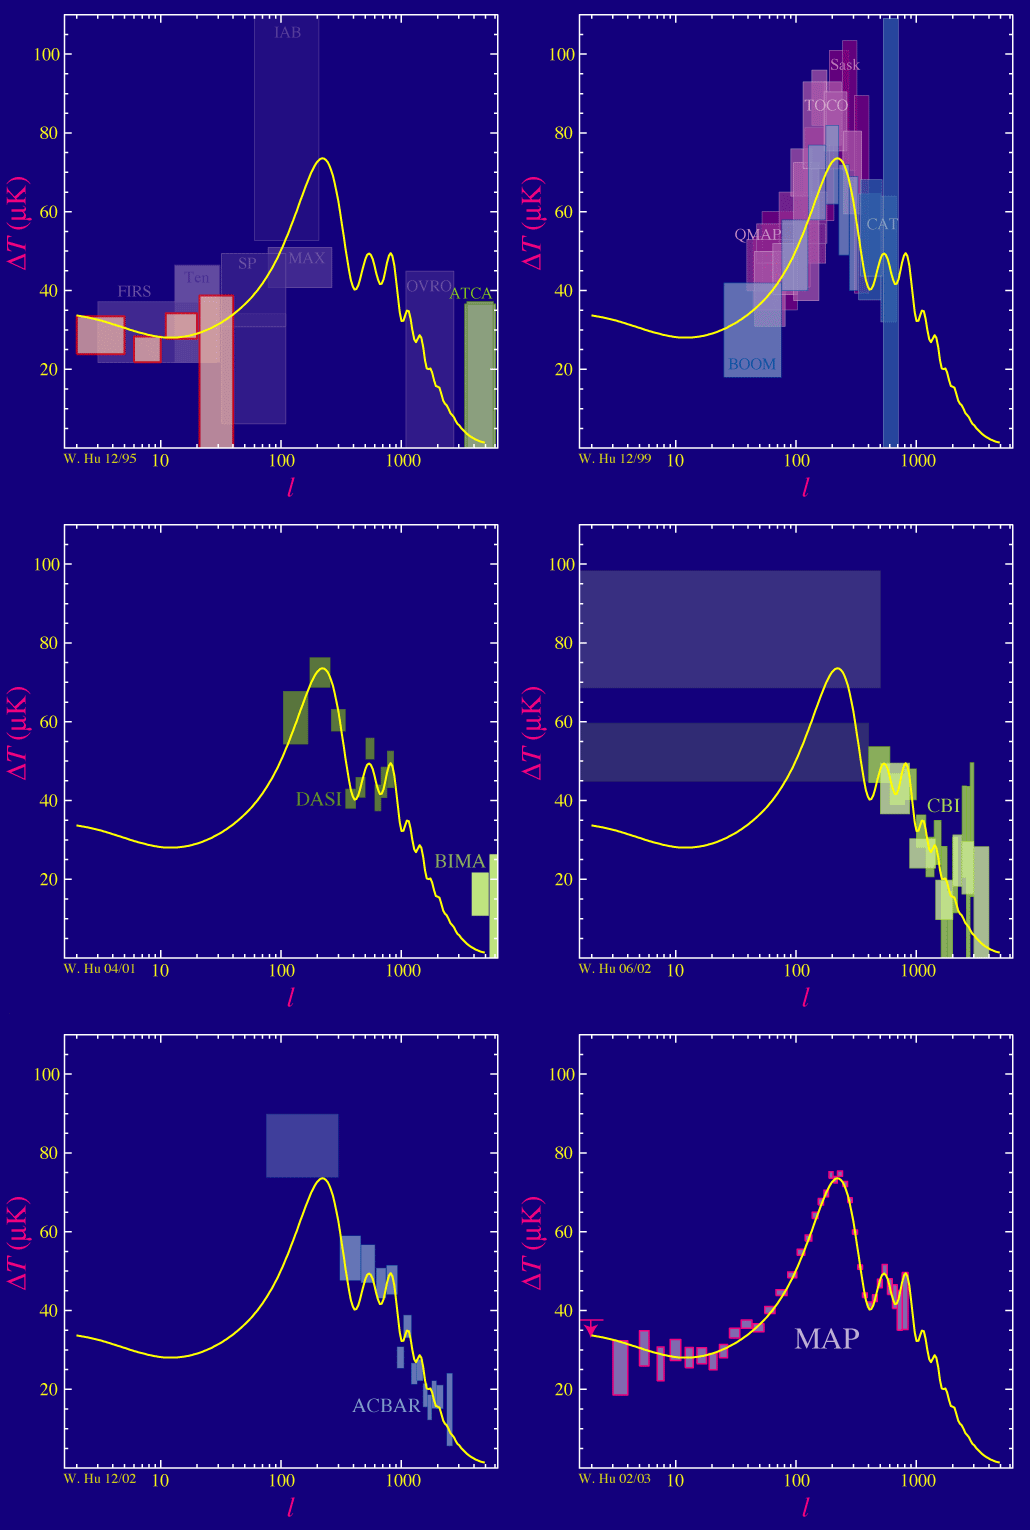
Since the COBE discovery, many ground and balloon-based experiments have shown the ripples peak at the degree scale. What CMB experimentalists do is take a power spectrum of the temperature maps, much as you would if you wanted to measure background noise. The angular wavenumber, called a multipole l, of the power spectrum is related to the inverse of the angular scale (l=100 is approximately 1 degree). Recent experiments, notably the Boomerang and Maxima experiments, have show that the power spectrum exhibits a sharp peak of exactly the right form to be the ringing or acoustic phenomena long awaited by cosmologists:



Fluctuations and the Origin of Galaxies :
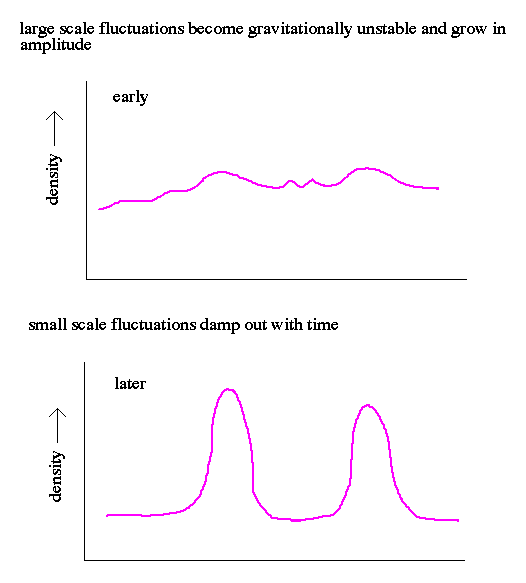
The density fluctuations at recombination, as measured in the CMB, are too large and too low in amplitude to form galaxy sized clumps. Instead, they are the seeds for galaxy cluster-sized clouds that will then later break up into galaxies. However, in order to form cluster-sized lumps, they must grow in amplitude (and therefore mass) by gravitational instability, where the self-gravity of the fluctuation overcomes the gas pressure.

|
|

|