Regression analysis involves identifying the relationship between a dependent variable and one or more independent variables. A model of the relationship is hypothesized, and estimates of the parameter values are used to develop an estimated regression equation. Various tests are then employed to determine if the model is satisfactory. If the model is deemed satisfactory, the estimated regression equation can be used to predict the value of the dependent variable given values for the independent variables.
Regression model.
In simple linear regression, the model used to describe the relationship between a single dependent variable y and a single independent variable x is y = a0 + a1x + k. a0and a1 are referred to as the model parameters, and is a probabilistic error term that accounts for the variability in y that cannot be explained by the linear relationship with x. If the error term were not present, the model would be deterministic; in that case, knowledge of the value of x would be sufficient to determine the value of y.
Least squares method.
Either a simple or multiple regression model is initially posed as a hypothesis concerning the relationship among the dependent and independent variables. The least squares method is the most widely used procedure for developing estimates of the model parameters.
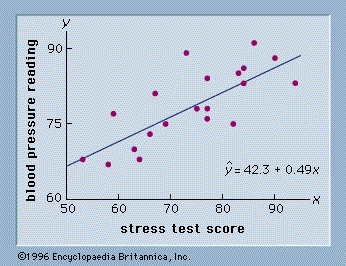
As an illustration of regression analysis and the least squares method, suppose a university medical centre is investigating the relationship between stress and blood pressure. Assume that both a stress test score and a blood pressure reading have been recorded for a sample of 20 patients. The data are shown graphically in the figure below, called a scatter diagram. Values of the independent variable, stress test score, are given on the horizontal axis, and values of the dependent variable, blood pressure, are shown on the vertical axis. The line passing through the data points is the graph of the estimated regression equation: y = 42.3 + 0.49x. The parameter estimates, b0 = 42.3 and b1 = 0.49, were obtained using the least squares method.

Correlation.
Correlation and regression analysis are related in the sense that both deal with relationships among variables. The correlation coefficient is a measure of linear association between two variables. Values of the correlation coefficient are always between -1 and +1. A correlation coefficient of +1 indicates that two variables are perfectly related in a positive linear sense, a correlation coefficient of -1 indicates that two variables are perfectly related in a negative linear sense, and a correlation coefficient of 0 indicates that there is no linear relationship between the two variables. For simple linear regression, the sample correlation coefficient is the square root of the coefficient of determination, with the sign of the correlation coefficient being the same as the sign of b1, the coefficient of x1 in the estimated regression equation.
Neither regression nor correlation analyses can be interpreted as establishing cause-and-effect relationships. They can indicate only how or to what extent variables are associated with each other. The correlation coefficient measures only the degree of linear association between two variables. Any conclusions about a cause-and-effect relationship must be based on the judgment of the analyst.
Excerpt from the Encyclopedia Britannica without permission.