Ishikawa's Cause & Effect Diagram
[SOURCE: http://www.pathmaker.com/resources/tools/cause.asp]
The cause & effect diagram is the brainchild of Kaoru Ishikawa, who pioneered quality management processes in the Kawasaki shipyards, and in the process became one of the founding fathers of modern management. The cause and effect diagram is used to explore all the potential or real causes (or inputs) that result in a single effect (or output). Causes are arranged according to their level of importance or detail, resulting in a depiction of relationships and hierarchy of events. This can help you search for root causes, identify areas where there may be problems, and compare the relative importance of different causes.
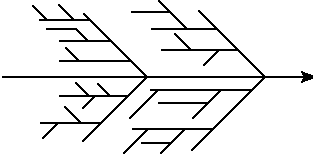
The C&E diagram is also known as the fishbone diagram because it was drawn to resemble the skeleton of a fish, with the main causal categories drawn as "bones" attached to the spine of the fish, as shown below.

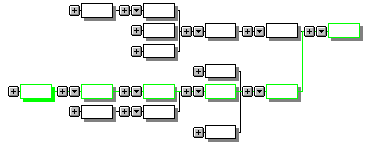
Cause & effect diagrams can also be drawn as tree diagrams, resembling a tree turned on its side. From a single outcome or trunk, branches extend that represent major categories of inputs or causes that create that single outcome. These large branches then lead to smaller and smaller branches of causes all the way down to twigs at the ends. The tree structure has an advantage over the fishbone-style diagram. As a fishbone diagram becomes more and more complex, it becomes difficult to find and compare items that are the same distance from the effect because they are dispersed over the diagram. With the tree structure, all items on the same causal level are aligned vertically.

To successfully build a cause and effect diagram:
- Be sure everyone agrees on the effect or problem statement before beginning.
- Be succinct.
- For each node, think what could be its causes. Add them to the tree.
- Pursue each line of causality back to its root cause.
- Consider grafting relatively empty branches onto others.
- Consider splitting up overcrowded branches.
- Consider which root causes are most likely to merit further investigation.