| Overview
The School Environment Assessment Tool (SEAT) is a tool that can help communities assess strengths and limitations of areas around schools in order to determine how consistent the neighborhood area is with waling and biking. Unlike other assessment tools, SEAT is designed with the dual emphasis of data collection and facilitating community organizing and capacity building. SEAT works on a handheld computer using sophisticated geographic information system software, but can be used by anyone regardless of their technological comfort level. Data is collected with SEAT within a workshop format attended by a cross section of participants of relevance to walking to a particular school. The benefits of this approach are:
- Community stakeholders collect data themselves, leading to investment in future actions
- Data is collected directly in a GIS format, reducing data entry error
- Workshop format allows maps and data analysis to be conducted the same day data is collected
- Resulting maps can be used by the coalition to target appropriate walking interventions or put pressure on appropriate city/state officials to do so
Basic Workshop Agenda (6 hours):
- Coffee (10 minutes)
- Introductions of Participants and Instructors (15 minutes)
- SRTS Overview and Discussion (35 minutes)
- Break (10 minutes)
- Guidance on how to use the SEAT data collection tool (60 minutes)
- Data Collection – workshop attendees will break into small groups and walk one or more routes to collect physical information on the primary walking routes leading to/from school. Box lunches will be distributed, which can be consumed while walking or during a short break during this assessment period (2.5 hours)
- Group will reassemble to discuss their experience using the data collection tool and their findings on the walking routes, plus have some food (40 minutes)
- Wrap-up with a reflection of the day’s workshop and discussion of next steps (30 minutes)
 |
 |
 |
 |
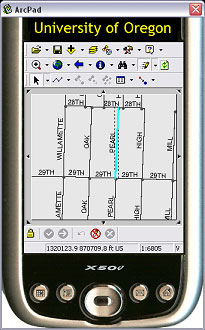
| This figure shows ArcPad GIS loaded on a personal digital assistant (PDA) - essentially a handheld and mobile version of GIS. Streets are shown in black with one selected street shown in blue. |
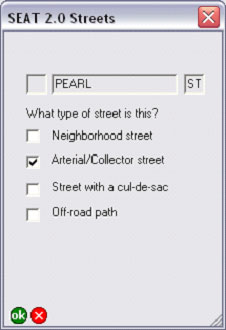
With the street selected, a customized data entry form can be called up in ArcPad. This tool is set up to collect data unique to each street type. |
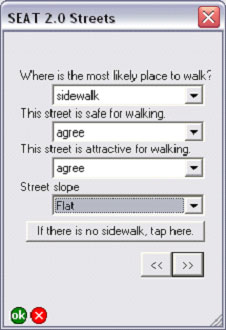
Here is one of the data entry pages that are completed as community members walk the neighborhood to asses the streets. |
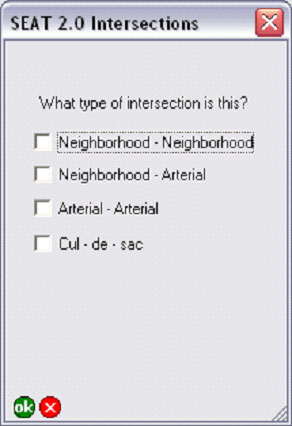
Separate data is collected for intersections, which represent particularly important barriers for children getting to or from school. |
Sample Maps
Here are two maps that were produced with community members. In the morning they learned how to use the SEAT tool, they then went out to collect data, and by the afternoon their data was synthesized and projected on a screen while they debriefed about what they observed while collecting data. These maps are then used to stimulate discussion and organize next steps for moving the Safe Routes to School agenda forward.
 
This work is supported by the Active Living Resource Center and the National Center for Biking & Walking.
|