|
|
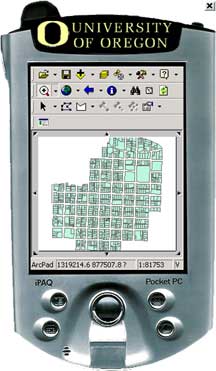
This is the entire study area - tax lots within the West
University Neighborhood. |
|
|
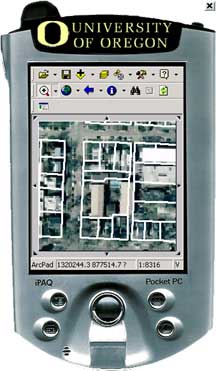
This is a zoomed in look at the parcels, with an aerial
photo visible in the background. The aerial photo helps the assessor
oriented him/herself within the neighborhood to ensure that the correct
property is being assessed. |
|
|
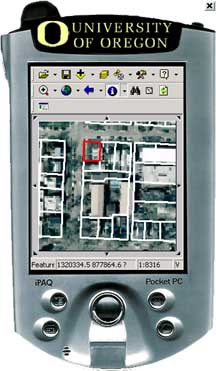
A parcel is selected, and once selected the data entry
screens automatically appear. |
|
|
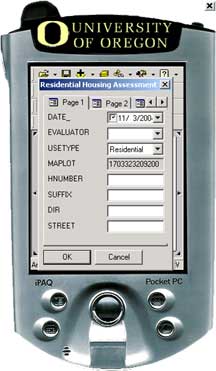
The first (of four) data entry screens appear. The
fields on this page are populated with more descriptive information - the
date the data was collected, the assessor's name, the maplot number, and
other data that may pre-exist in the parcel file. Because the data
collection is done directly in GIS, all entered data is directly linked to
the map. Inversely, basic information like the maplot number is
already in the parcel file and can be displayed automatically in this data
entry form - no manual entry of the maplot number is required. |
|
|
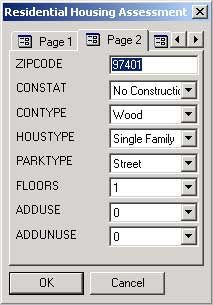
On page 2, the assessor begins his/her actual assessment.
With ArcPad-based mobile GIS, the assessor can stand on the sidewalk with
a PDA and enter the assessment directly from observation to computer -
there is no need for a clipboard or an awkwardly sized laptop or tablet
PC. |
|
|
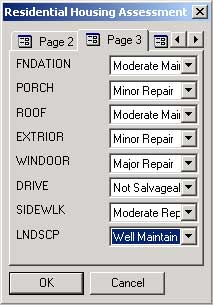
On page 3, additional residential condition assessments
are made utilizing pre-defined drop down lists in order to minimize data
entry time and error. |
|
|
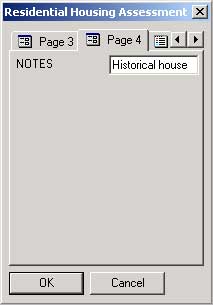
On page 4, there is an opportunity for the assessor to add
any field notes specific to the property being assessed. The data
entry area can be much longer than is shown in this image if need be. |