|
|
| Introduction |
|
FAPROTAX is a manually constructed database that maps prokaryotic taxa (e.g. genera or species) to metabolic or other ecologically relevant functions (e.g. nitrification, denitrification or fermentation), based on the literature on cultured representatives. For example, if all cultured species within a bacterial genus (or more precisely, all type strains of species) have been identified as denitrifiers, FAPROTAX assumes that all uncultured members of that genus are also denitrifiers. Functions represented in FAPROTAX focus on marine and lake biogeochemistry, particularly sulfur, nitrogen, hydrogen and carbon cycling, although other functions (e.g. plant pathogeneicity) are also included. The complete list of functional groups covered by FAPROTAX, as well as all literature used, can be found within the database itself.
|
|
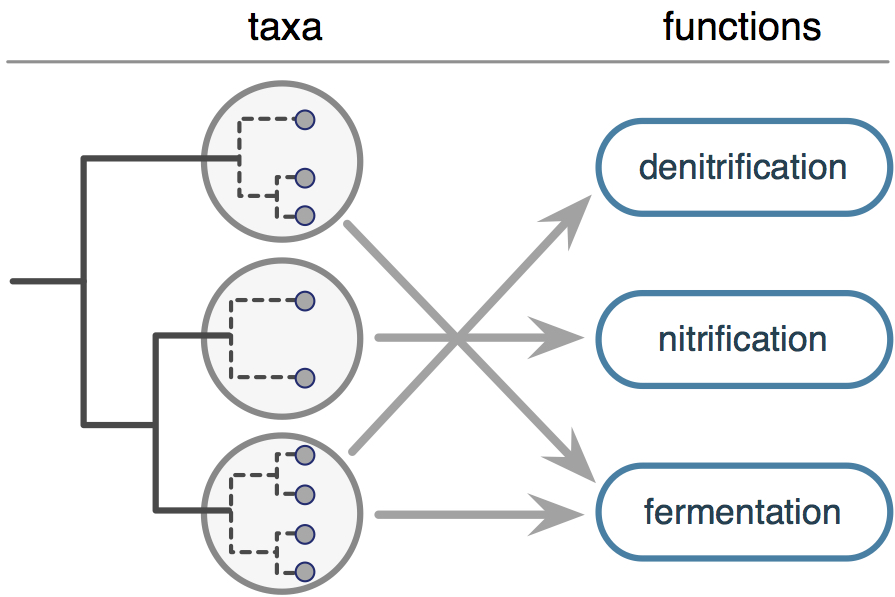 |
FAPROTAX comes with a versatile script (collapse_table.py) for converting prokaryotic taxon abundance profiles ("OTU tables" or "taxon tables") into putative functional group abundance profiles ("function tables"), based on the taxa identified in a sample and their functional annotations in FAPROTAX.
In FAPROTAX, a taxon may be affiliated with multiple functions. For example, Sulfurospirillum arsenophilum is affiliated with nitrate ammonification, arsenate respiration and fermentation.
Hence, each detection (e.g. 16S amplicon sequence) of S. arsenophilum in a sample is interpreted as the detection of a putative nitrate ammonifier, a putative arsenate respirer and a putative fermenter.
On the other hand, functional groups may be nested; for example all taxa associated with nitrate denitrification are also associated with nitrate respiration and nitrate reduction.
|
|
| Limitations |
FAPROTAX affiliates taxa with functional groups by extrapolating knowledge on a subset of well-studied organisms (cultures or isolates) to all other organisms, based on existing literature.
We made a great effort to ensure the accuracy of functional annotations, however human error cannot be excluded. Further, an implicit assumption of FAPROTAX is that if all cultured members of a taxon can perform a particular function (at the time of the publications cited), then all members of the taxon (cultured and non-cultured) can perform that function. As more organisms are being cultured, some of these generalization may turn out to be false.
FAPROTAX is non-exhaustive, that means it is likely that many organisms known to perform certain functions may be missing or may only be partially included in the database. For example, a species known to be capable of sulfate respiration as well as fermentation, may have been only annotated as a sulfate respirer but not as a fermenter (e.g. if fermentation was shown in a subsequent publication).
FAPROTAX's performance in creating function tables from taxon tables relies strongly on the quality and resolution of taxonomic identifications. OTUs with poor taxonomic identification (e.g. only down to order level) will usually be ignored by FAPROTAX, because many functions are only conserved at the species or genus level. Likewise, functions exhibiting poor phylogenetic conservatism (e.g. if encoded by plasmids) are poorly covered by FAPROTAX.
Finally, using FAPROTAX for some scientific questions may require manual refinement or extension of the functional annotations, for example based on expert knowledge of the system examined. FAPROTAX is written in a human-readable format that allows for easy modification (but see our license agreement).
|
|
| Usage overview |
Conversion of OTU/taxon tables to function tables based on FAPROTAX is performed by the python script collapse_table.py, which is available here.
Optionally, this script can also generate a report of the process, a table listing which OTU was assigned to which functional group, a table listing the overlaps between functional groups (in terms of shared OTUs) as well as a list of the FAPROTAX annotations that were utilized for the particular input data. In addition, one can generate sub-tables of the input OTU table listing only OTUs associated with a particular functional group (i.e. one sub-table per functional group). This may be useful for analyzing the taxonomic variation across samples within individual functional groups.
The exact normalization used for the function table, the format of the input table and the format of the output tables can be modified using command line arguments. Detailed instructions are given below.
| |
 |
|
| Requirements |
- The FAPROTAX database, available here. This is a plain text file in a human-readable format, and you can view its contents using any modern text editor.
- The python script collapse_table.py, available here. This script translates OTU/taxon tables into function tables, based on taxon-function annotations in the FAPROTAX database.
- Input OTU/taxon tables can either be in classical format (e.g. with tab-separated columns, one column per sample and one row per OTU), or in the recently published BIOM format (JSON or HDF5 variants).
BIOM is the default OTU table format generated by QIIME. The OTU table must include taxonomic paths, either as a separate column/row (for classical tables), as OTU metadata (for BIOM tables) or as OTU names (for classical and BIOM tables).
- When working with BIOM tables, you will also need the BIOM-format python package.
- When working with BIOM HDF5 tables, you will also need the h5py module. This python module must be installed prior to installing the BIOM package.
- The script collapse_table.py works with python 3.7, Mac OS 10.13.6 and BIOM package version 2.1.8. The latest version does not work with python 2.7 anymore.
|
|
| Overview of main collapse_table.py options |
| -i, --input_table | | Path to input OTU table listing OTU abundances per sample, in classical (tabular) or BIOM format. By default columns should represent samples and rows should represent OTUs or taxa. |
| -g, --input_groups_file | | Path to FAPROTAX database file, or any other similar specification of groups by which to collapse the OTU table. |
| -o, --out_collapsed | | Path to output function table, listing functional group abundances per sample. (optional) |
| -r, --out_report | | Path to output report file, listing OTUs associated with each functional group and some other summary statistics (optional). |
| -s, --out_sub_tables_dir | | Path to output directory, to which sub-tables of the original OTU table (one per functional group) shall be saved. Each sub-table will only list OTUs included in the particular functional group. (optional) |
| --out_groups2records_table | | Path to output table listing which OTUs were associated with which functional group. By default this information is saved as 1 (association) or 0 (no association), but this can be adjusted via --normalize_groups2records_table. (optional) |
| --out_group_overlaps | | Path to output table, listing the pairwise Jaccard overlap between functional groups (in terms of shared OTUs). (optional) |
| --out_group_definitions_used | | Path to output file, listing the subset of FAPROTAX annotations used for the input OTU table. (optional) |
| -d, --row_names_are_in_column | | Column listing the taxonomic paths in the input OTU table (if in classical format). If column names are available as a header (see option --column_names_are_in), this specifies a column name, otherwise it specifies a column index (first column is 0). |
| --collapse_by_metadata | | Name of OTU metadata field containing taxonomic paths in the input OTU table (if in BIOM format). If a taxon table is used instead (i.e. row names are taxonomic paths), this should be left blank. |
| --dont_parse_group_metadata | | (Flag) Don't include any functional group metadata (as specified in the FAPROTAX database) in the output tables. |
| --column_names_are_in | | Where column names (e.g. sample names) are listed in the input OTU table. Options are 'none' (no column names listed), 'last_comment_line' and 'first_data_line' (default). |
| --table_delimiter | | Column delimiter in the input OTU table (if in classical format); this will also used for any classical output tables. By default a tab is used. |
| --omit_columns | | Comma-separated list of any column indices to ignore in the input OTU table (if in classical format). For example, if the first column lists OTU IDs (not taxonomic paths), you should pass '--omit_columns 0', otherwise the first column will be treated as another sample. |
| --group_leftovers_as | | Optional group name for listing all OTUs not assigned to any functional group. |
| --omit_unrepresented_groups | | Omit functions from the output table that have not been identified in any sample. |
| -b, --binarize_input_table | | Convert the input table into binary format, i.e., only listing presences (values>0) or absences (values<=0) rather than abundances or proportions. This may be used, for example, if you only care about the number of distinct OTUs per function, regardless of their relative proportions in a sample. |
| -n, --normalize_collapsed | | How to normalize the output function table. Options include 'none' (no normalization, default), 'columns_before_collapsing' (TSS of the OTU table), 'columns_after_collapsing' (TSS of the function table), 'columns_before_collapsing_excluding_unassigned' (TSS of the OTU table restricted to functionally assigned OTUs). |
| -v, --verbose | | (Flag) Show process details in the command line. |
| -f, --force | | (Flag) Replace all existing output files without warning. |
| -h, --help | | (Flag) Show a description of all available options. |
| |
| Using FAPROTAX with OTU tables in BIOM format |
To convert a BIOM OTU table to a BIOM function table, use the script collapse_table.py as follows:
|
collapse_table.py -i tax_table.biom -o func_table.biom -g FAPROTAX.txt -v
|
The above commnand assumes that the FAPROTAX database as well as the input OTU table (tax_table.biom) are located in the same directory as the script.
The command also assumes that observation IDs in the BIOM table are taxonomic paths (not OTU numbers). This is the case for BIOM tables generated by the QIIME scripts summarize_taxa.py or summarize_taxa_through_plots.py.
Alternatively, observation IDs may not be taxonomic paths, and taxonomic paths may instead be stored as metadata (e.g. 'taxonomy').
This is the case for OTU tables generated by several QIIME scripts, such as make_otu_table.py or pick_open_reference_otus.py.
In that case, the above command can be modified to the following:
The appended option '-v' tells the script to print out progress reports.
|
|
| Using FAPROTAX with classical (tabular) taxon tables |
To convert a classical taxon table (tab-separated format) into a function table, use:
|
collapse_table.py -i tax_table.tsv -o func_table.tsv -g FAPROTAX.txt -d "taxonomy" -c "#" -v
|
The above command assumes that rows correspond to taxa, that the column 'taxonomy' contains the taxonomic paths and that all other columns correspond to samples.
We use the option "-c" to specify that any comments in the input table are preceded by the "#" symbol (as is usual in bioinformatics).
The above command also assumes that the first non-comment line in the table is a header line containing all column names. Alternatively, if the header line is a comment line immediately preceding the table, indicate so using the option "--column_names_are_in last_comment_line", as follows:
If no header line with column names is available, use the option "--column_names_are_in none" to specify so, and use the option "-d" to indicate the index of the taxonomy column instead (the first column starts at 0).
For example, the following command assumes that taxonomic paths are in the first column and that all other columns correspond to samples:
If some columns contain data that is to be omitted from the conversion (e.g. metadata for each taxon or OTU IDs), use the options "--only_columns" and "--omit_columns" to filter out columns.
For example, if the first column in the input table contains OTU IDs (not taxonomic paths) and columns 101-103 contain irrelevant OTU metadata, then the following command will ignore these columns:
|
|
| Other options |
The script collapse_table.py included with the FAPROTAX database is very versatile in terms of the input table format, the output format and the intrepretation of the database.
Typically most options should be left at their default values.
A description of all possible options can be obtained directly from the script using the flag "-h":
For example, to count all taxa not included in any functional group towards a separate group 'other', use the option "--group_leftovers_as" as follows:
In addition to the collapsed function table, the script can also create a report listing the taxa assigned to each functional group (e.g. for verification or troubleshooting purposes).
Use the option "-r" to specify the report's file path, e.g. as follows:
|
collapse_table.py -i tax_table.biom -o func_table.biom -g FAPROTAX.txt -r report.txt -v
|
To normalize the output table using total sum scaling (TSS) use the option "-n" as follows:
Alternatively, to normalize columns prior to collapsing, use "-n columns_before_collapsing" for TSS, or "-n columns_before_collapsing_excluding_unassigned" for TSS based on OTUs assigned to at least one functional group.
By default, the output table is in the same format as the input table (BIOM or classical).
To explicitly choose between BIOM or classical table format, use the option "--output_format_collapsed", for example:
|
|
| Taxonomy format in the input table |
|
The script collapse_table.py assumes that taxonomic paths in the input table include as many hierarchical levels as possible (including domain level, and down to species or strain level), and that hierarchical levels are not immediately prefixed by alphanumeric characters or a dash ("-").
Typical valid examples are the Greengenes and SILVA formats:
Entries with coarser taxonomic resolution (e.g. down to the genus or family level) are also allowed in the input table, however these will typically be assigned to fewer functional groups.
For example, none of the following taxonomic paths will match Chlorobaculum thiosulfatiphilum in the FAPROTAX database, but both will match Chlorobaculum and Chlorobiaceae:
The FAPROTAX database is optimized for taxonomies in SILVA releases 128 and 132. Other taxonomies not consistent with SILVA 132 may work sub-optimally. Greengenes taxonomies should be avoided because they usually don't provide species-level resolution.
|
|
| Example 01: TSV input table |
|
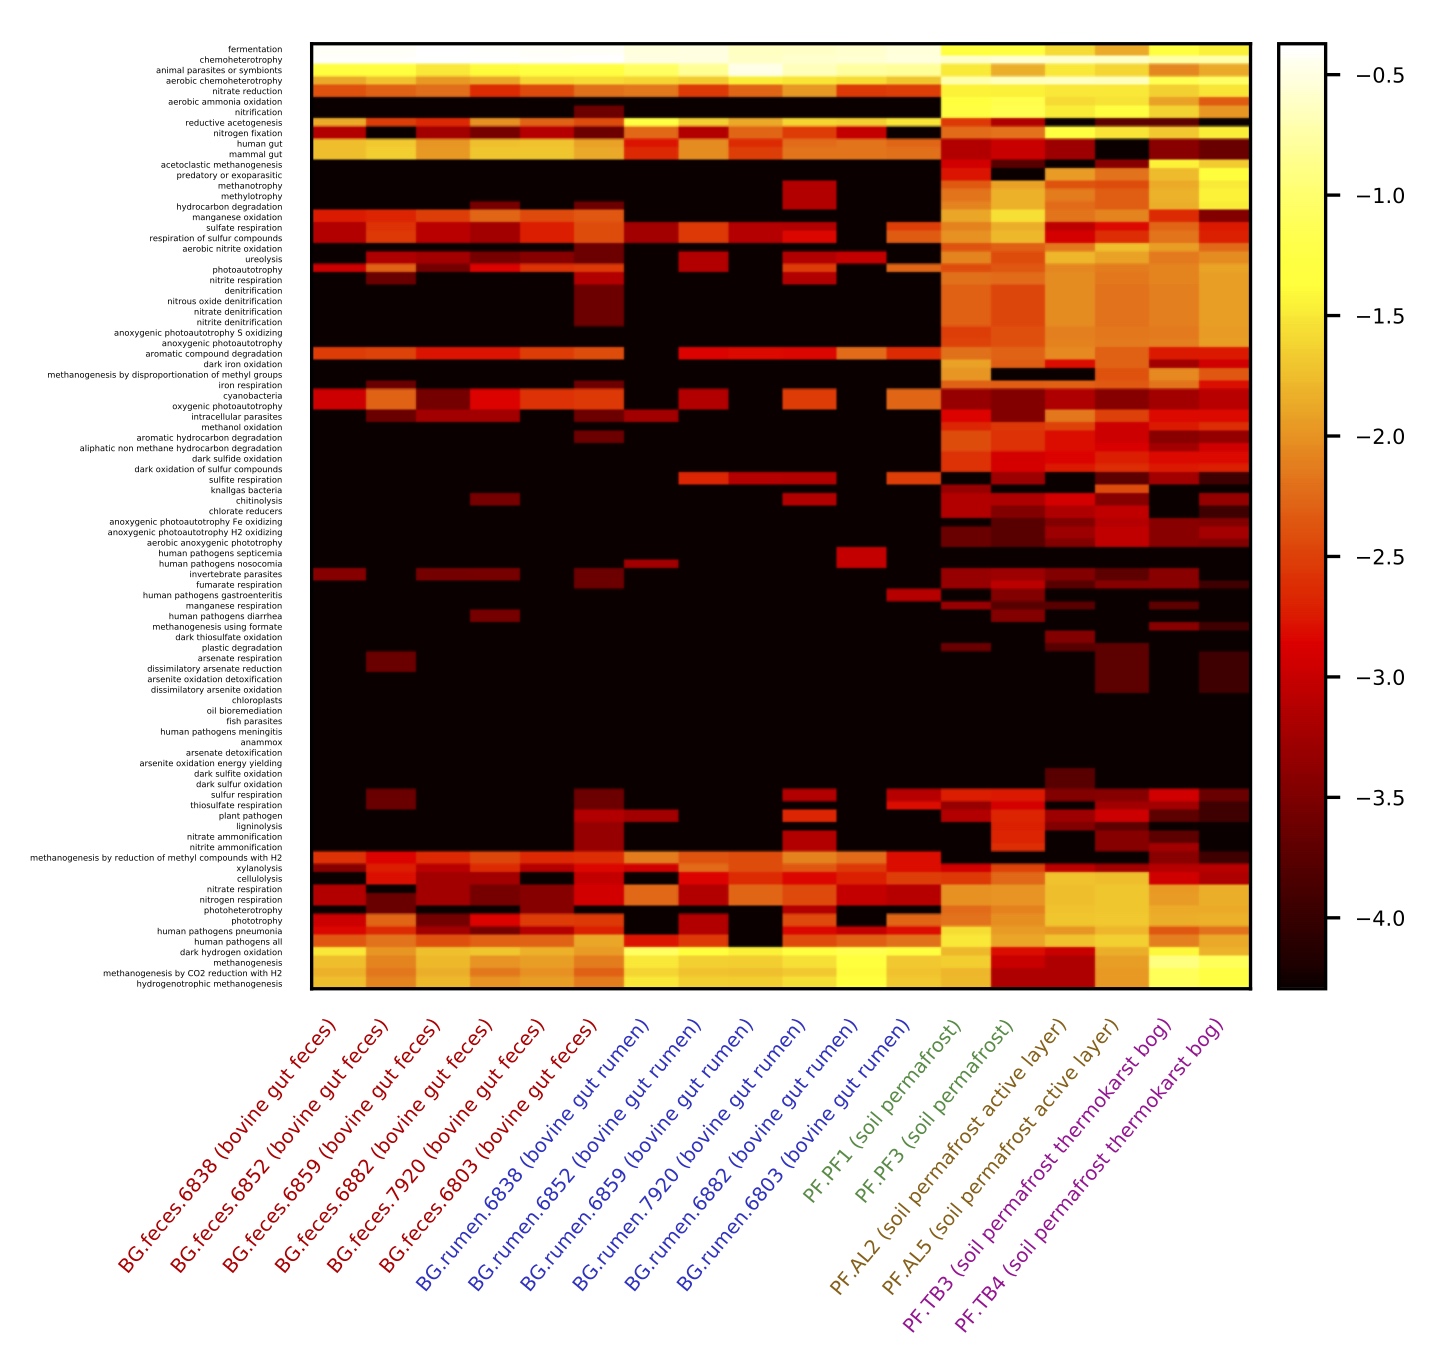
In this example we use a classical OTU table (in TSV format, available here), which lists OTU numbers in the first column and taxonomic paths in the column called 'taxonomy'. The table's column names are provided as a comment line preceding the table data. Hence, we use the following command in the terminal to transform the OTU table into a function table:
On a modern laptop, the above command may take a few minutes.
Note that we used the option "-n columns_after_collapsing" to create a function table with TSS-normalized columns, and the option "--omit_columns 0" to make sure the first column is not interpreted as an additional sample.
|
The above command creates a function table (also in TSV format, available here), in which each column corresponds to a sample and each row corresponds to a functional group.
As stated in the report file (available here), 9885 out of 30755 OTUs (~32%) could be assigned to at least one functional group.
A heatmap of the function table, with samples coloured according to environment, is shown on the right.
Observe the separation of bovine rumen, bovine feces and permafrost samples, particularly with respect to sulfur cycling. Note: You can generate similar heatmaps using the QIIME script make_otu_heatmap.py.
|
|
 |
|
| Example 02: BIOM input table |
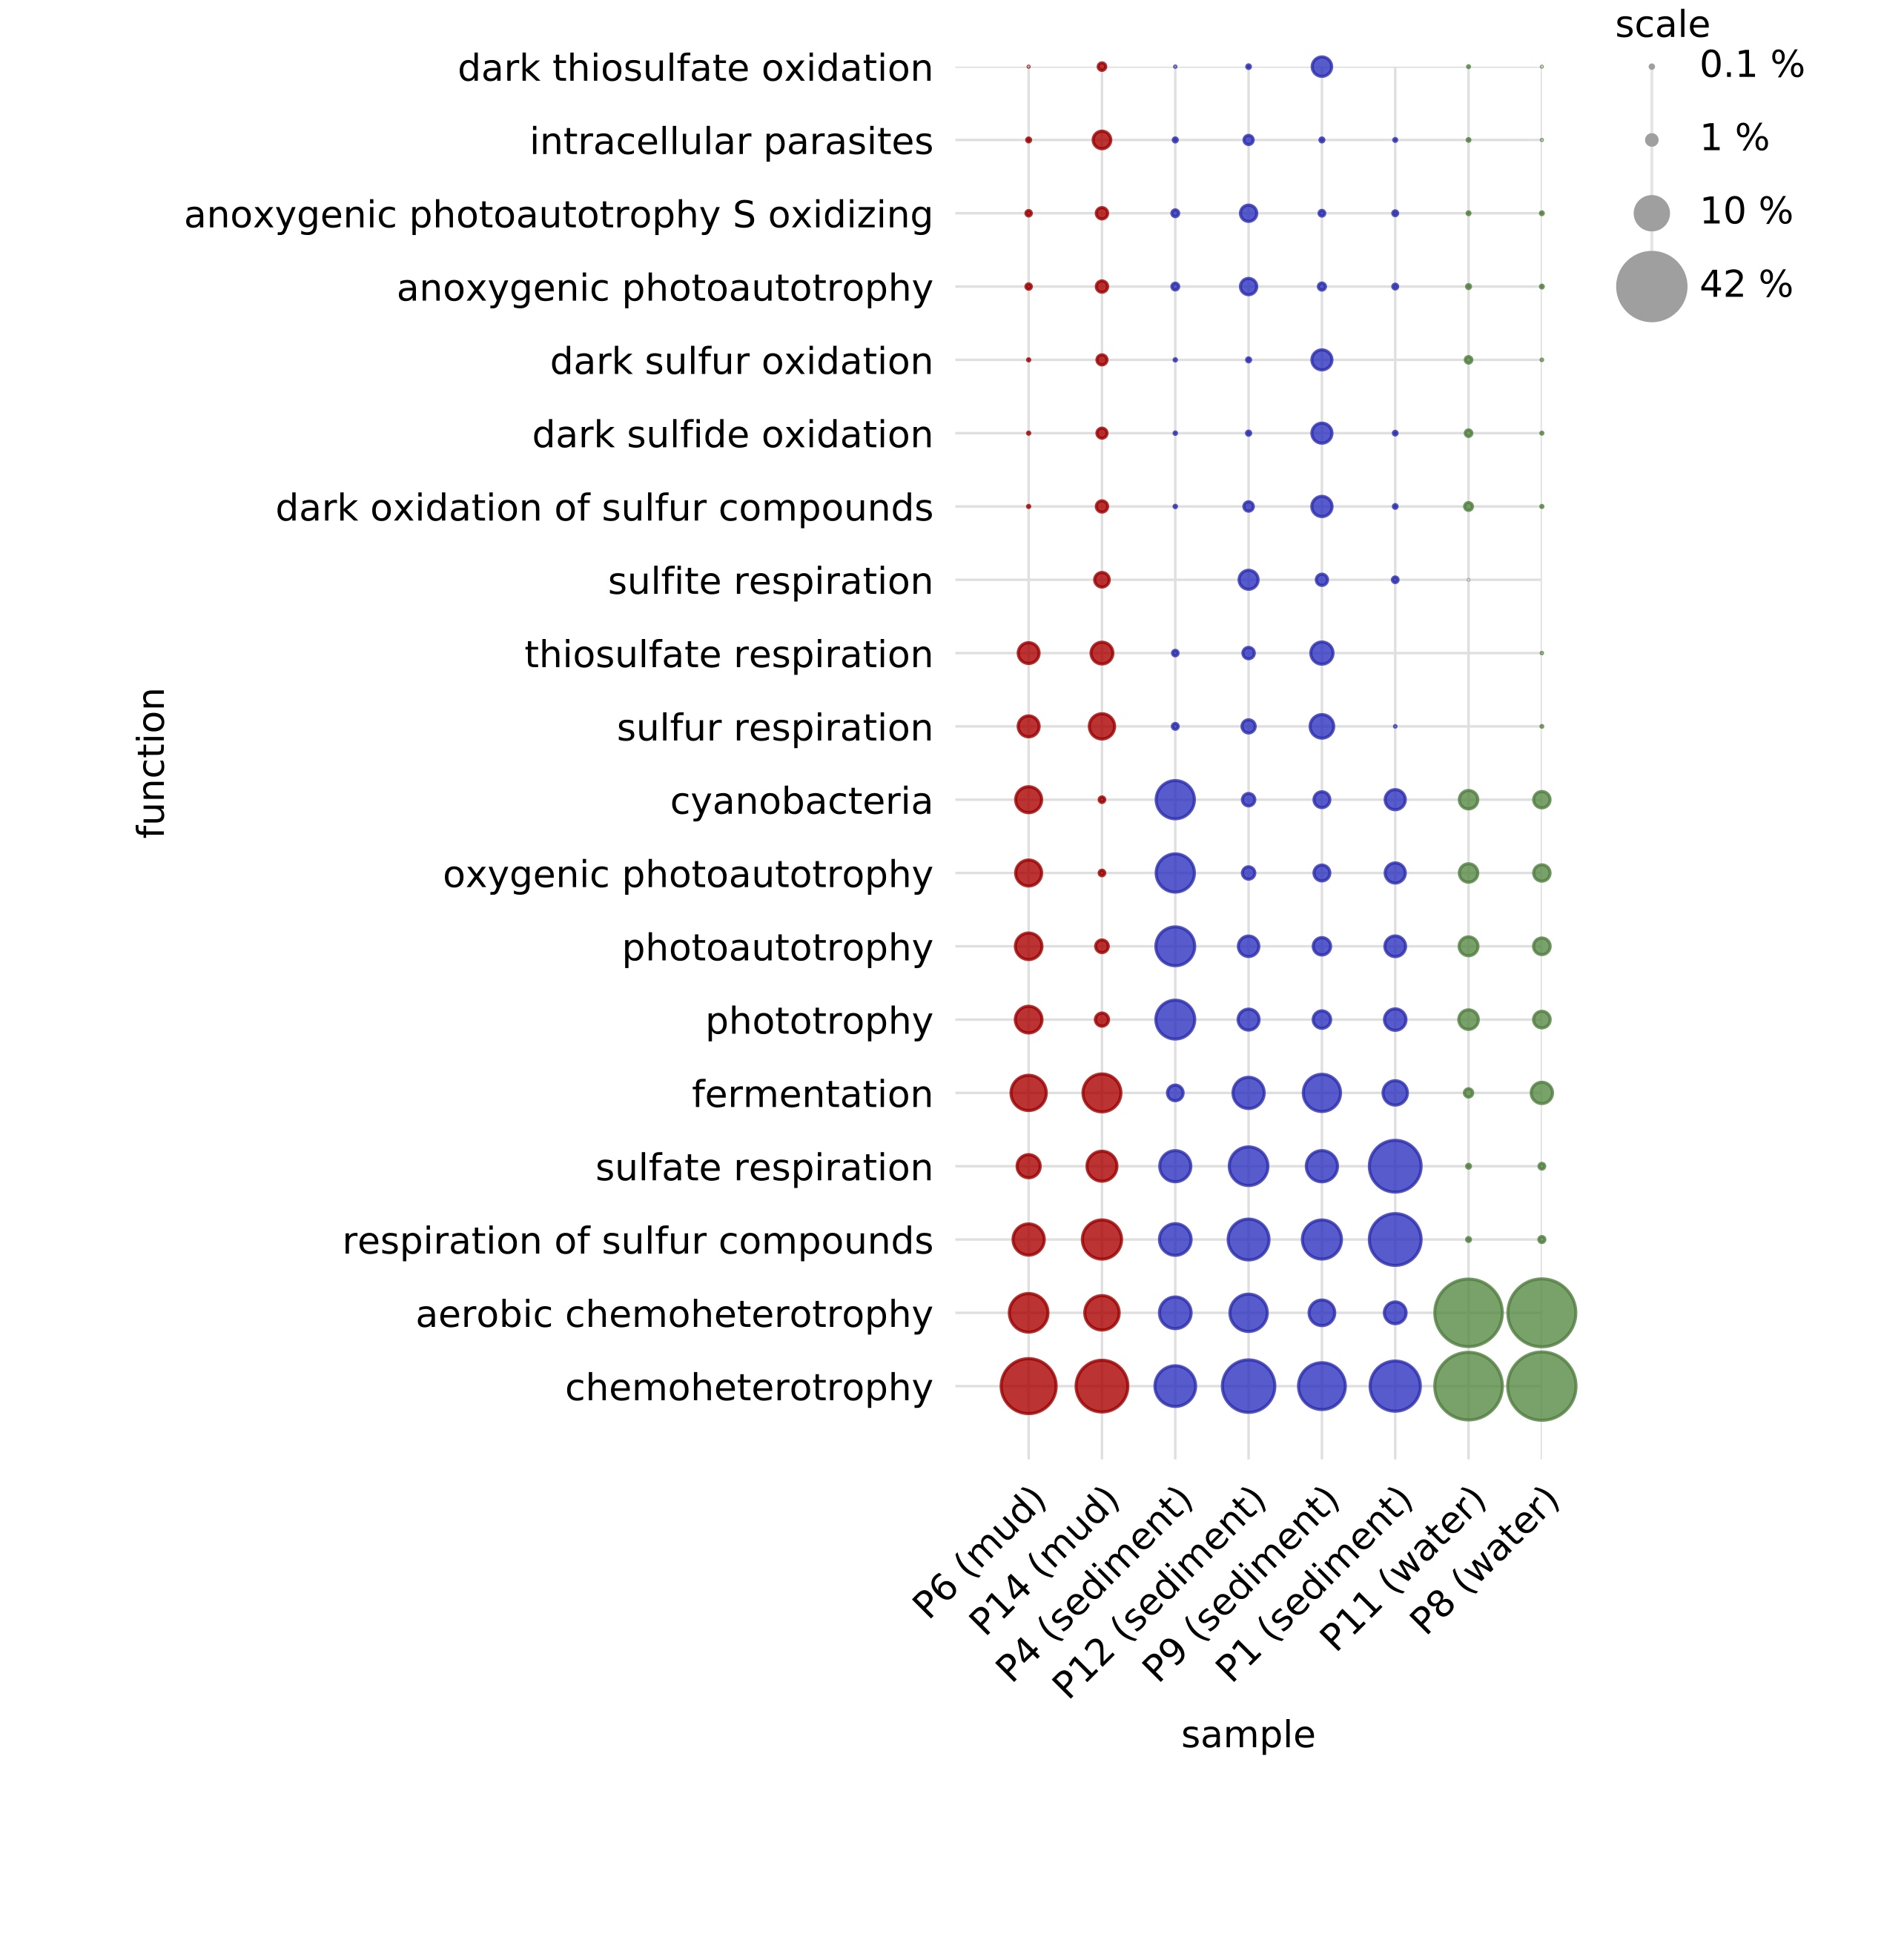
In this example we use an OTU table in BIOM format (available here), generated using the QIIME script make_otu_table.py.
In this table observation IDs are set to OTU numbers, and taxonomic paths are included as observation metadata ('taxonomy').
Hence, we use the following command in the terminal to transform the OTU table into a function table:
|
The above command creates a function table (also in BIOM format, available here), in which each column corresponds to a sample and each row corresponds to a functional group. Any sample metadata stored in the original OTU table is also included in the function table.
As stated in the report file (available here), 1259 out of 4972 OTUs (~25%) could be assigned to at least one functional group.
A bubble chart of the function table, with bubbles coloured according to environment, is shown on the right (only the most abundant functional groups are shown).
Observe the separation of water and mud/sediment samples taken from the same shallow lakes, particularly with respect to aerobic chemoheterotrophy and sulfur cycling.
|
|
 |
|
| Frequently Asked Questions |
I get an a warning message that the BIOM and/or H5PY module could not be loaded, even though they are installed
This problem can occur when you have multiple python installations on your mac (e.g., Apple's default, QIIME's, Anaconda), and the one invoked by the script differs from the one for which you installed BIOM and/or H5PY. This is a common problem with python on Macs. Googling "module not found python mac" or similar, should give you a lot of discussions on the topic.
One quick solution would be to point the script to the appropriate python installation, by changing the first line of the script. For Mac users with MacQIIME, "/macqiime/bin/python" has worked in the past. Alternatively, you can install the BIOM and H5PY modules for the correct python version on your system. For Anaconda2 users, the following has worked in the past:
conda install -c bioconda biom-format=2.1.5
I get the error "ERROR: Unknown group 'nitrate_denitrification..." on Windows
This problem can occur on Windows when passing the command-line argument -c '#' with single-quotes.
Windows console does not properly pass arguments in single quotes.
Please use double quotes to pass arguments, as demonstrated in the examples above. In fact, it is generally recommended to use MacOS, Linux or other UNIX for bioinformatics tasks.
I get a message that the taxonomy column cannot be found in the OTU table
This problem can occur for a variety of reasons. If your OTU table uses quotes aruond column names (as is the case with some Excel-generated TSV files), then collapse_table.py will assume those quotes are part of the actual column names. In that case, you should simply remove the quotes from the OTU table's column names, or alternatively specify the taxonomy column name with additional quotes.
Another situation where this error may occur is if your OTU table's column names are encoded in a column line, and you have not specified this when calling collapse_table.py; in that case, make sure to pass the argument:
--column_names_are_in last_comment_line
|
|
Louca lab. Department of Biology, University of Oregon, Eugene, USA
© 2026 Stilianos Louca all rights reserved
|
|
|

