USGS National Water Information System (NWIS)
Tutorial
NOTE: There are
TWO ways to access stream-gage (river discharge) information from the USGS NWIS
on-line database!
Use METHOD 1 to access data based on
search criteria –OR- use METHOD 2 to access data from a map interface.
1) From within your web browser, browse
to the USGS NWIS website for Oregon surface Water Data or select the link on
the Water Trader for a Day website.
The main page gives you a
choice of data types to select from including real-time streamflow data, daily,
monthly, and annual statistics, and peak-flow data.
2) Decide which type of data you are
interested in. For this tutorial
exercise, select “DAILY” to get daily streamflow data.
You will now see a list of
choices regarding criteria you wish to include in your search for a specific
river reach.
3) Under “Site Identifier”, make sure
that the “Site Name” box is checked.
Make sure all other options are turned off. Hit “SUBMIT”.
You will now see a page that
has options to help you search for a specific stream reach that you are
interested in.
4) In the “Site Name” field, type in the
name of the river or stream you are interested in. For this tutorial, type in “Deschutes”.
5) Select parameters you are interested
in finding data for. For this
tutorial, select the box next to “Streamflow, ft3/s.”
6) Choose your desired output
format. This determines the format
your search results will be given to you in. For this tutorial, select the box next to “Brief Descriptions.” Leave all other options as they
are. Hit “SUBMIT.”
You will now see a list of
stream-gage locations with the type of data you are interested in.
7) Scroll through your list of
stream-gage locations. Note that
each has a period of record listed.
This tells you the time period for which there is data. Select a specific gage site that is at
an appropriate location and has data for the time period you are interested in. For this tutorial, select the box to
the left of “USGS
14092500 DESCHUTES RIVER NEAR MADRAS, OR.”
8) Once you have selected you
stream-gage, scroll to the bottom of the page. Here you can again choose your desired output format for the
search. For this tutorial, select
the box next to “List of sites with links available for Daily Statistics.” Hit “SUBMIT.”
You now see the site for your
selected stream-gage location. At
the bottom of the page, under “Choose Output Format,” you can request a table
of daily streamflow statistics for the site over a requested period of
record. However, for this
tutorial, we will instead create a graph showing streamflow over a requested period of record.
9) At the top of the page, you will see a
drop-down menu next to “Available Data for this Site.” Select “Time-Series: Daily Data” and
hit “GO.”
Note the useful information
for your stream-gage on the top half of the screen.
10) Scroll down to the box above “Summary of
additional data for this site.”
Select the box next to “Discharge” and make sure all other available
parameters are turned off. The
“Output Format” should be “Graph.”
For this tutorial, change the “Begin Date” for the output to
“2002-06-10.” Hit “GO.”
Wait for the screen to
completely finish loading. Scroll
down. You will see a 5-year
hydrograph for your selected stream-gage site.
11) Below the graph, select the “Create
Presentation-Quality Graph” link.
You will now see the same
graph on a new page. This image
can be saved to the desktop (right-click on the image and select “save to
desktop”) or copied into a word-processor document
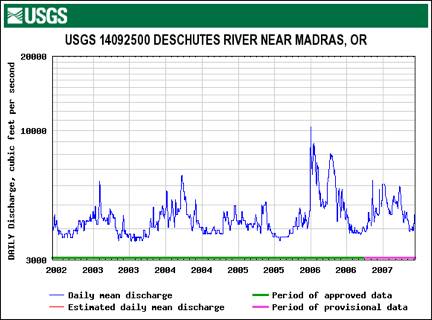
Your graph should look
like this:
1) From within you browser, browse to the
StreamStats page for Oregon, or select the link from the Water Trader for a Day
website.
2) Click on the “Interactive Map” link.
Wait for the interactive map
interface to load completely. This
map interface works in much the same way as the Deschutes Basin Water Issues
interactive map.
3) On the right side of the screen, click
on “Water” under the “Map Layers” tab.
Then make sure that the box next to “Stream Gages” is selected. At the bottom of the list. Hit “Refresh
Map.”
This turns on the “stream
gages” map layer. You will now see
many triangles appear on the map.
Each triangle represents a specific stream-gage location.
4) Now, from the top of the screen (right
side), select the gage info tool.
It should look something like this:
![]()
5) Now click on one of the triangles on
the map representing stream-gage locations. A new page will pop up called “Streamflow Statistics
Report.” Below the title, you will
see the name of the stream-gage location you have selected.
6) If you have selected the stream-gage
you are interested in, click on the link below the stream-gage name that says
“Click here to link to available data on NWIS-Web for this site.”
You will now be connected to
the same NWIS page arrived at in Step 8 of Method 1.
7) Begin creating a 5-year streamflow
hydrograph by following steps 9 – 11 from Method 1.