Interactive Lecture Demonstrations
Prediction
Sheet--Newton's 1st & 2nd Laws
Directions: Click here to download the Prediction Sheet. You may
be asked to turn in this sheet to your instructor. Follow directions. It is very important that you make your
predictions before making observations.
|
Demonstration
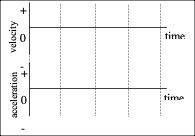
1: The positive direction is to the right. The
frictional force acting on a small toy cart is very small (almost no
friction) and can be ignored. The cart
is pulled with a constant force (the applied force) so to the right and
speeds up at a steady rate (constant acceleration). On the axes on the right sketch your
predictions of the velocity and acceleration of the cart and the applied and
net force on the cart after it is released and during the time the cart is
moving under the influence of the constant force. (Applied and net force are
the same in this case. Why?) Only
after you have made your predictions, observe the motion of the cart and the
resulting graphs by clicking FvaVideo1. After you view
the video, you can click on FVAGraph1 to have the
graphs persistently displayed on the screen. Compare
the graphs to your predictions and explain any differences. Demonstration
2: The frictional force acting on the cart is
now increased. The cart is pulled with
the same constant force (the applied force) as in Demonstration 1 so that it
moves to the right speeding up at a steady rate (constant acceleration). On the same axes to the right sketch your
predictions of the velocity and acceleration of the cart and the applied and
net force on the cart after it is released. (Note that the applied and net
force are different now. Which one
determines the acceleration?) We are
measuring only the applied force. Only
after you have made your predictions, observe the motion of the cart and the
resulting graphs by clicking FvaVideo2. After you view
the video, you can click on FVAGraph2 to have the
graphs persistently displayed on the screen. Compare
the graphs to your predictions and explain any differences. Summarize
your observations: (1)
Newton's Second Law says that the acceleration of an object is determined by
which: the applied force or the net force? Explain based on your
observations. (2)
If an object is acted on by an applied force and friction, how do you
calculate the net force? |
|
|
Demonstration
3: The positive direction is to the right. A
toy cart has equal and opposite forces acting on it (due to two fans blowing
in opposite directions). The frictional
force is very small (almost no friction) and can be ignored. The cart is given a quick push to the right
and released. Sketch on the right your
predictions of the velocity and acceleration of the cart after it is released. What
is the net (or resultant) force on the cart after it is released? Only
after making your predictions, click DuelingFans to download and view the movie. Compare
your observations to your predictions and explain any differences. Can an
object with no net force acting on it move? How
is this related to Newton's First Law? |
|
|
Demonstration 4: The positive direction is to the right. A
crate is on the surface of a frozen lake so that friction is very small. The crate is given a brief push to the
right and then released. Sketch on the
axes on the right your predictions of the velocity and applied force for the
motion, including the time during the
push. Is the net force the same as
the applied force in this case? Only after you have made your
prediction, open the simulation Forces and Motion: To set up to graph Force and Velocity
click on FORCE GRAPHS and then Velocity+. Click on the X
to get rid of the barriers. On right check Ice (no friction) and Choose
Small Crate as the object. Use the
slider to set the Position as far to the left as possible. Set the
force to +200 N by typing 200 in the box and then click Compare the resulting graphs to your
predictions and explain any differences. After the force is no longer applied
(reduced to zero) does the crate still move? Why? How is this related to Newton's First
Law? |
|
|
Demonstration 5: The positive direction is to the
right. The frictional force acting on
the crate remains very small (almost no friction) and can be ignored. The crate is given a push toward the right
and released After it is released, a
constant force pushes on it to the left.
It moves to the right, slowing down at a steady rate (constant
acceleration), comes to rest momentarily
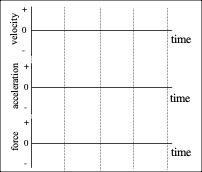
and then moves to the left, speeding up at a steady rate. Sketch on the axes on the right your
predictions of the velocity and acceleration and of the force on the crate after the crate is released. Only after you
have made your predictions, use the same simulation, Forces and Motion,
to test them. First click Reset All and Yes.
To set up to graph Force, Velocity and Acceleration click on FORCE GRAPHS
and then Acceleration+ and Velocity+. Get rid of the barriers,
check Ice (no friction), Choose Small Crate and set the Position
as far to the left as possible. Set the force to +500 N and then click Compare the
resulting graphs to your predictions and explain any differences. Why is the net force on the crate essentially
the same as the applied force in this case? How does the acceleration at the point
the crate reverses direction compare to the acceleration before it reverses
direction? After? Explain. How does the force at the point the
crate reverses direction compare to the force before it reverses direction?
After? |
|

