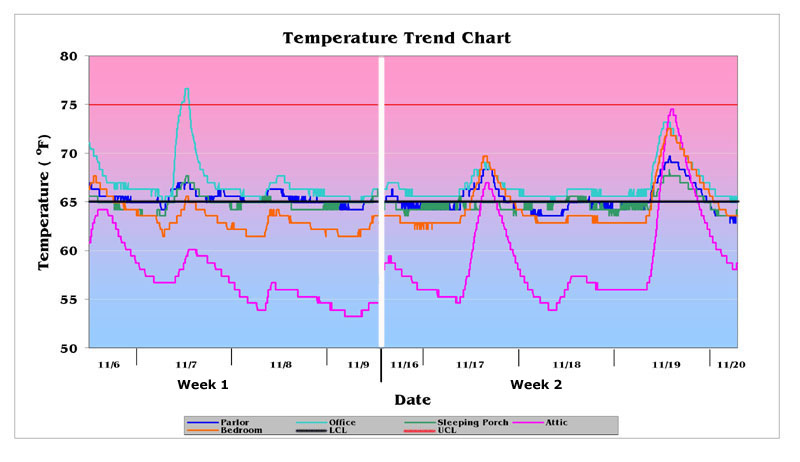
The following chart shows the trend of the temperature data as compared to the operating temperature guideline:
| Temperature
The following chart shows the trend of the temperature data as compared to the operating temperature guideline: |
||||
|
||||
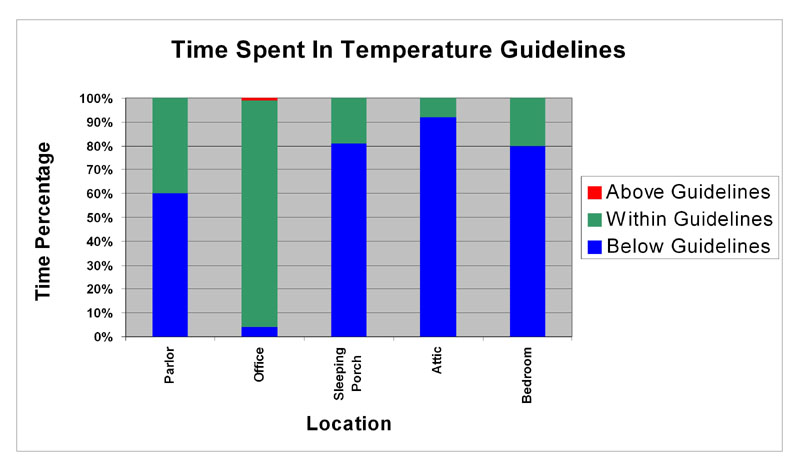
| As can be seen, the temperatures generally fall below the upper control limit (UCL) for the temperature guideline, with the exception of one incident in the office that may be related to use of a space heater. Many of the trend lines hover at or below the lower control limit (LCL). The chart below indicates how much time the temperature fell within the guidelines. | ||||
|
||||
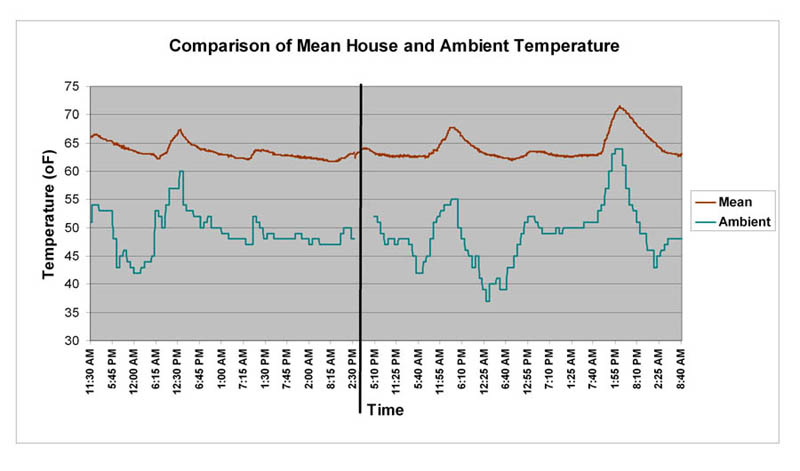
| This chart indicates that the office is the most climate-controlled room of the five studied. This is not too surprising, given that this room is the most occupied of the ones being measured. With the exception of the office, the areas under consideration tend to spend a great deal of time at temperatures below the operational guideline. This may not too surprising, given the time of year, but it may indicate that the environment of the house is largely controlled by the ambient environment. The following chart gives a comparison of the mean house temperature with the ambient temperature: | ||||
|
||||
| As the chart indicates, the temperature in the house generally follows the trends of the ambient temperature. This may not be too much of a problem in the fall and winter months, as temperatures slightly below the guidelines are generally not considered as harmful as high temperatures. However, it may indicate that the internal house temperatures during the summer months will also be correspondingly higher and more damaging to the artifacts in the house. | ||||