|
|
|
|
|
|
ENVIRONMENTAL QUALITY AND LAND PRODUCTIVITY:
A COMPARISON OF THE AGRICULTURAL LAND BASE
OF THE USSR AND NORTH AMERICA
N. C. FIELD
University of Toronto
Source = 1968:Canadian
Geographer, vol. 12. #1. pp. 1-14
[SAC editor adjusted tables slightly to fit www format and provided this hypertext link with certain of the tables =
TABLE I = cropland resources of the USSR and north america
TABLE II = relationship between crop distributions and yields in the USSR
TABLE III = thermal and moisture ratings
[SAC editor introduced bold-face and hypertext links to SAC, more directly to relate the article to our course]
[Of the 9 passages in bold face, I would particularly note a long passage which pulls some main arguments together]
[Of the several useful hypertext linkages with SAC, I would especially recommend two places with map links = #1 and #2.]
At a very broad level of comparison, the geographer may point to a number of striking parallels between the agricultural land base of the Soviet Union and that of North America. The total land area of the USSR only slightly exceeds that of Canada and the United States if the latter two countries are treated as a single entity. And on both continents, climate and terrain have combined in such a way as to limit the arable land resource to an almost identical fraction of the total land mass. Thus in physical extent the cropland resource of the Soviet Union closely approximates that of North America. It is of some interest, also, that these land resources over the centuries have come to support human populations of the same general magnitude. The figures in Table I illustrate the remarkable similarities in the agriculturally productive land resource and population base of the two regions. The analysis in this paper has been confined to a comparison of developed cropland or arable land, the latter being defined to include cultivated fallow and improved pasture in addition to the acreage from which crops are harvested in any given year. Although natural pasturelands somewhat exceed the cropland resource in acreage, their contribution to the farm economy would represent only a small fraction of total agricultural output. Moreover, the ratio of cropland to natural grazing land in the USSR does not differ substantially from that in North America.
TABLE I
cropland resources
of the USSR
and
north amErica
Total
Land Area (million sq. miles)Cropland *
1966
Population (millions)Cropland
Per
Capita (acres)
(million
acres)(% of
land area)
Canada
United States
3.8
3.6
103
448
4
19
20
196
5.1
2.3
north america
USSR
7.4
8.6
551
566
11
10
216
232
2.6
2.4
* For the USSR, the acreage
in orchards and other perennial crops has been added to the arable (pashnia)
land category to obtain a total cropland figure. Cropland for Canada represents
the improved acreage (1961 Census) and for the United States the
cropland acreage (1959 Census).
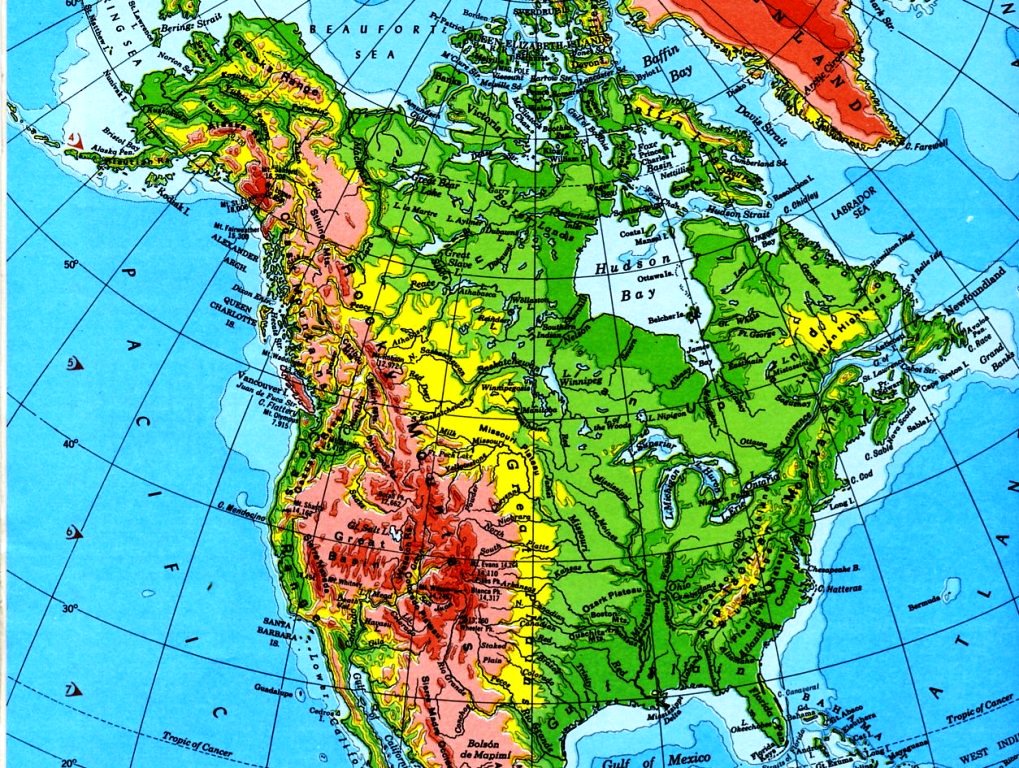
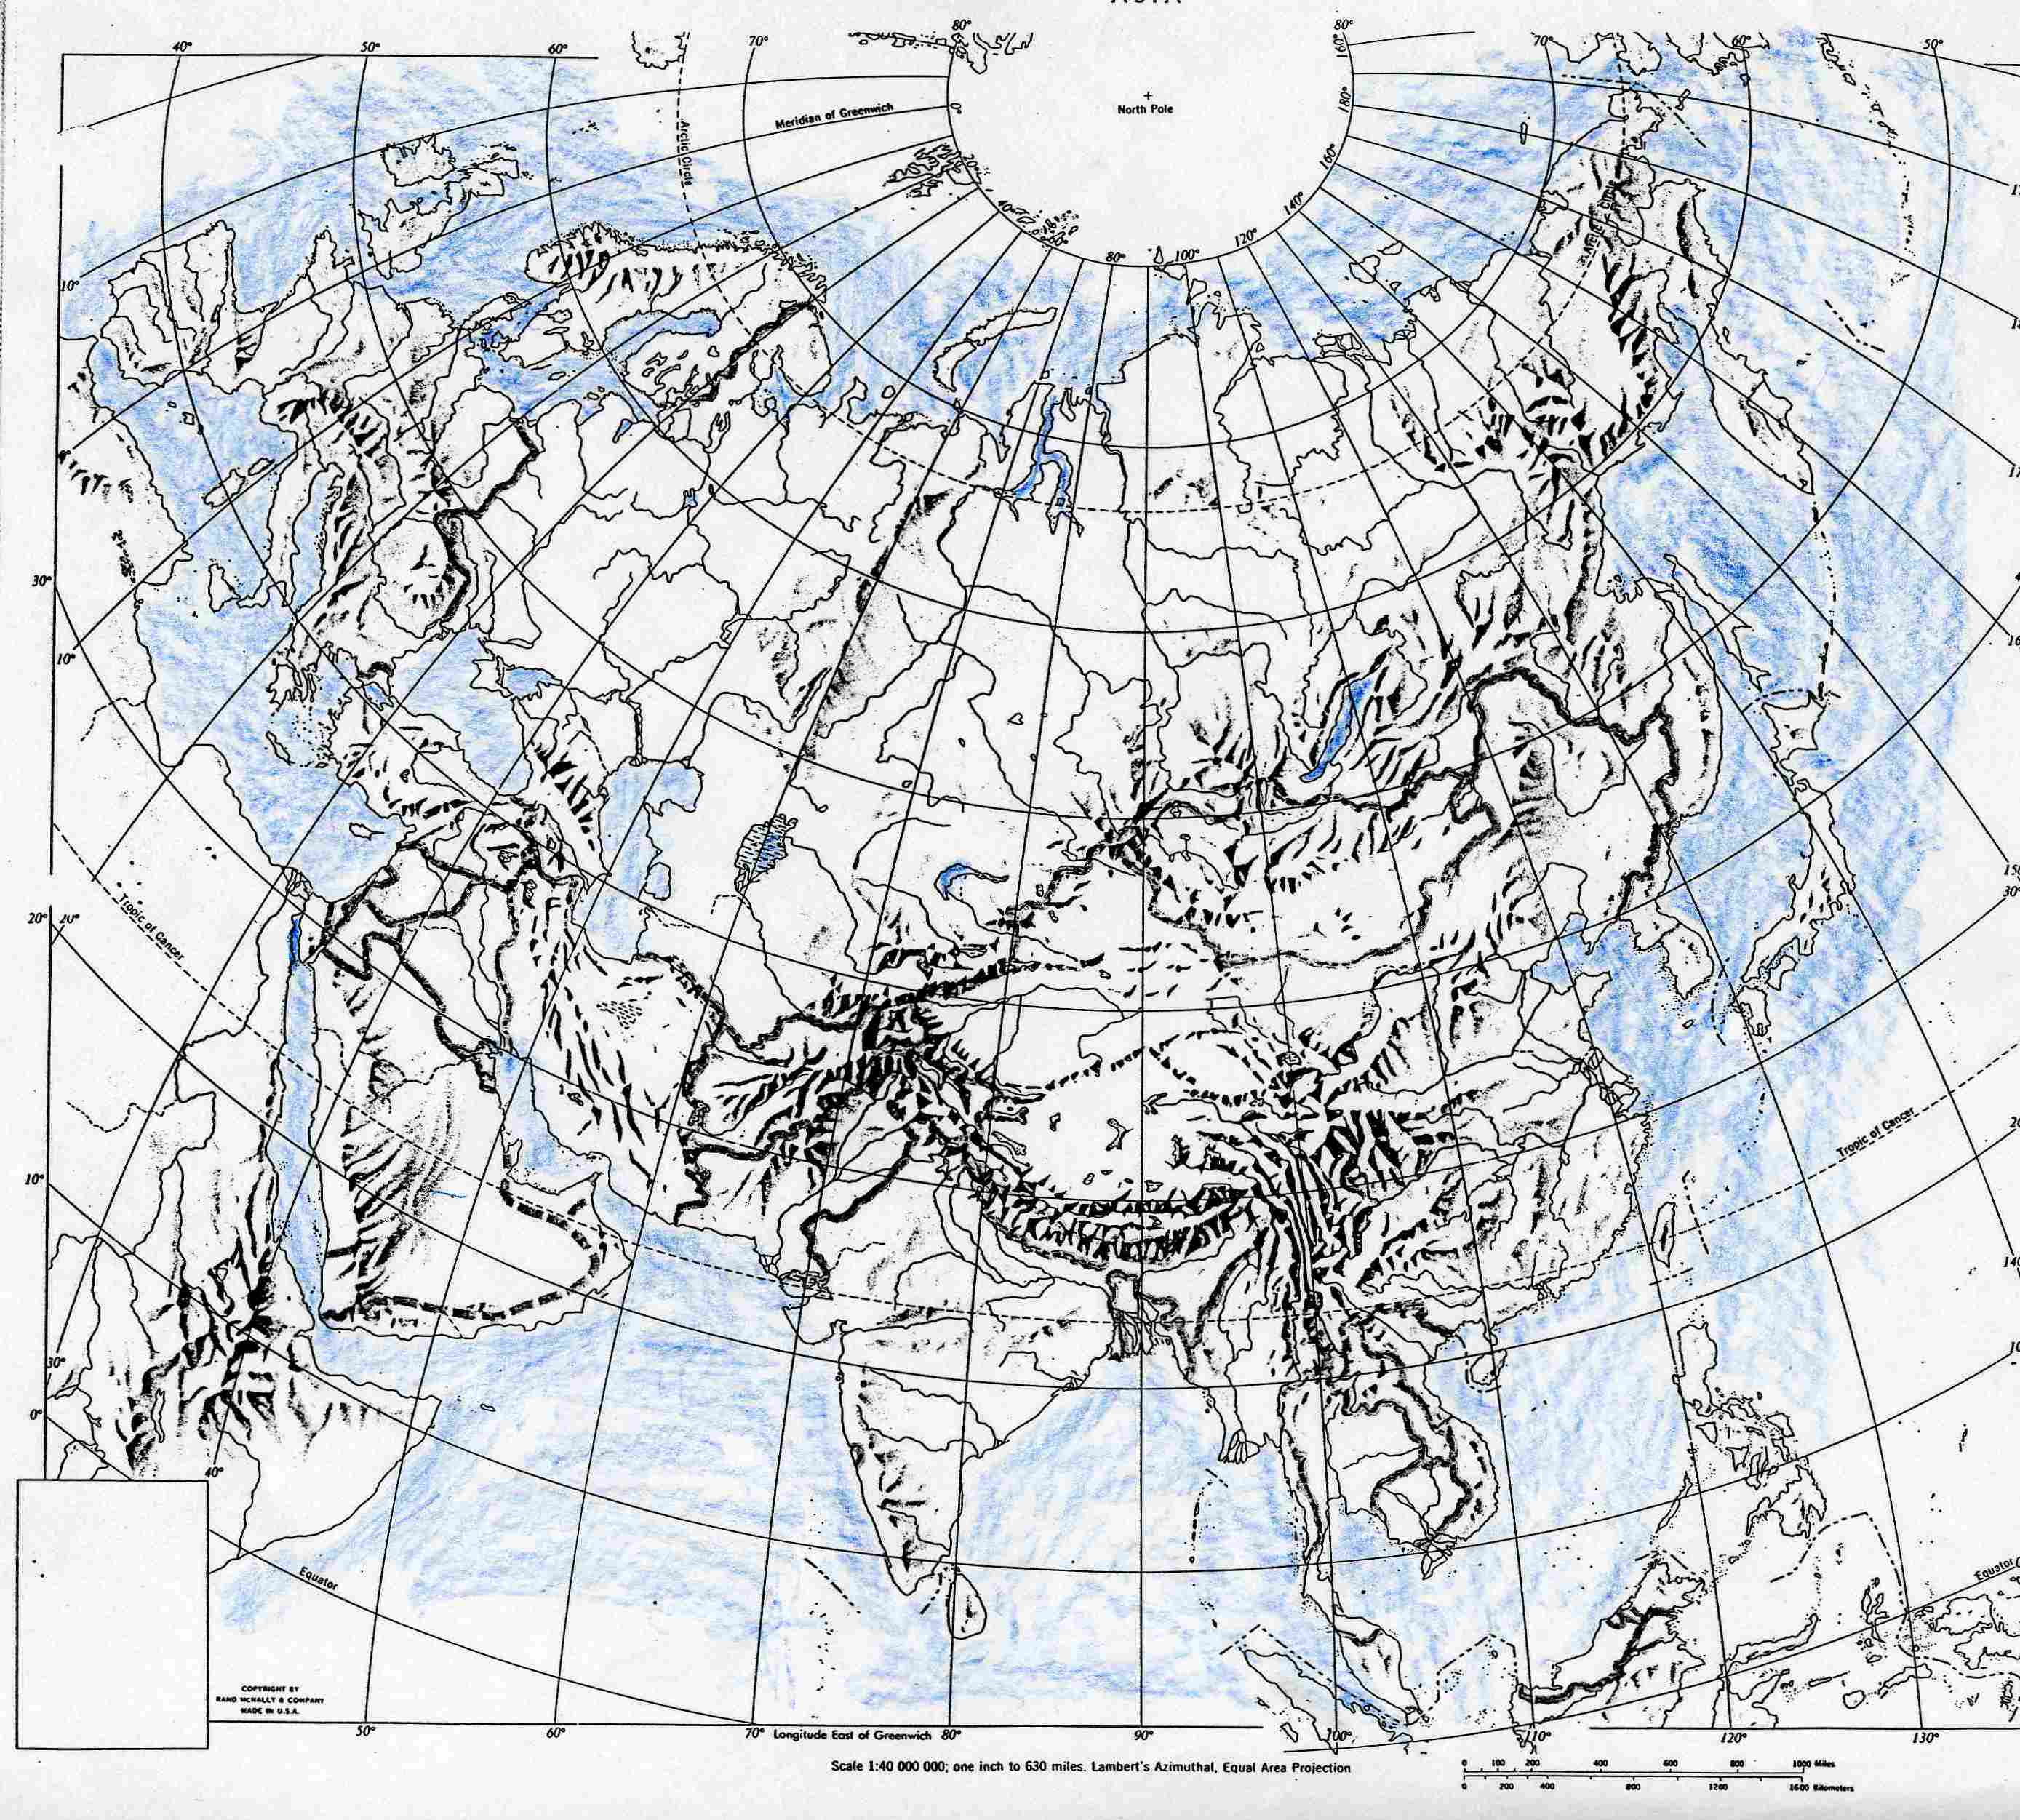
Not only is the agricultural land base of the Soviet Union similar to that of North America in physical extent; general parallels may also be seen in the environmental setting. On both continents, the poleward margin of the closely settled agricultural zone abuts on the fringe of the northern forest, and is restricted by similar thermal indices. [MAP indicating late-winter snow in the N.hemisphere | Same MAP with current snow coverage] In the southern interior, extensive agricultural settlement has been limited
1/2
by conditions of excessive aridity. The intensive pockets of irrigated farming in Soviet Central Asia find their counterpart in the American Southwest. Between these two extremes, the farmlands of the USSR and North America encompass a broad east-west belt of variable agricultural productivity, grading from the more humid forest lands adjacent to the Atlantic to the extensive grassland plains of the interior. Approximate climatic analogues can be found in North America for most of the agricultural regions of the USSR. [MAP USA relief | MAP Eurasia relief | MAP of N.American grain belt | MAP of Eurasian Russian grain belt]
In view of the foregoing similarities, it is not surprising that North America is often employed as a frame of reference in assessing Soviet agricultural problems and achievements. The common features, however, tend to mask significant contrasts in the character of the agricultural environments of the two continents. In particular, important differences exist in the spatial distribution of cropland with respect to climatic zones of varying productive potential. It is the purpose of this paper to examine the magnitude and significance of these differences and, in a very broad sense, to evaluate the quality of the Soviet Union's agricultural land base relative to that of Canada and the United States. It is only within the framework of such an overview that the agricultural patterns and policies of the USSR can be adequately appraised.
In the analysis which follows, a comparison is first made between the average productivity of Soviet and North American cropland as a whole. Regional variations in the productivity of the cropland base within the USSR are then examined in order to demonstrate the importance of measuring the relative concentration of arable land with respect to environmental zones of markedly variable quality. Factors contributing to regional differences in the productivity of cropland are next discussed, and the rationale explained for emphasizing climate as the primary determinant. A classification scheme for categorizing environments, based on accumulated summer temperatures and the water balance, is proposed. The paper concludes with an inventory of the arable land resources of the Soviet Union and North America, cross-classified with respect to the two major climatic components, temperature and moisture, and with a discussion of the distributional patterns in a comparison of the quality of the agricultural land base of the two world regions.
RELATIVE PRODUCTIVITY OF SOVIET AND NORTH AMERICAN CROPLAND
Over the past several decades, improved technology and more intensive agricultural inputs have given rise to considerably higher returns from cropland in both the USSR and North America, At the same time, the average productivity of Soviet cropland has remained substantially below that of North America, particularly that of the United States. From a cropland base 25 per cent larger than that of the United States, the USSR has been obtaining an agricultural output only about 70-75 per cent as great.1 Thus, on a per acre basis, the productivity of Soviet cropland has averaged not more than 60 per cent that of the United States. Relative to the combined cropland resources of Canada and the United States, Soviet cropland might be rated as about two-thirds as productive per acre. A question naturally asked is how far the lower average returns from the Soviet Unions agricultural land base can be attributed to the human factor, and how far to fundamental differences in the quality of the physical environment.
3/4
AGRICULTURAL LAND BASE OF USSR AND NORTH AMERICA
Although general recognition has been given in the literature to environmental differences, there has been a tendency to attribute a very substantial share of the USSR's production problems to the organization of the farm economy or to technological backwardness—in short, to the human element. It is worth noting, therefore, that the average productivity of Canada's cropland resource on a per acre basis is not more than one-half that of the United States.2 In fact, it falls at least slightly below the level of even the USSR.3 Clearly, environmental quality must be investigated as an important variable before North American experience can be used to evaluate the performance of the Soviet farm economy.
Within both the USSR and North America, substantial regional variations can be noted in the relative productivity of the cropland resource. The pattern in the USSR will be used to illustrate the magnitude of these differences. Although spatial variations in the income level and standard of living of the farm population complicate the analysis, the ratio of cropland to farm population provides at least a rough index of regional gradients in the returns derived from arable land. The gradients described below, represent those prevailing within the collective farm segment of the Soviet farm economy.4 [7-hop SAC LOOP]
The characteristic ratio throughout most of the mixed forest belt of Central European Russia is one of about 15-20 acres of cropland per farm family. A similar ratio prevails throughout the wooded steppe [prairie] and steppe regions of South European Russia, demonstrating that the more favourable thermal conditions in the south roughly counterbalance the more favourable moisture conditions further to the north, in terms of their effect on the productive capacity of the land resource. Further to the east, as moisture and thermal conditions both deteriorate, relative to the foregoing zones, the density of farm population drops off sharply. The ratio of cropland per collective farm family increases progressively, averaging almost 40 acres in the Volga region [ggr], 60 acres in West Siberia [ggr], and still higher in North Kazakhstan [ggr]. Within the main agricultural belt of the Soviet Union, the highest farm population densities are found in the West Ukraine [ggr] and adjacent Moldavia where the more attractive moisture conditions of Central European Russia and the thermal conditions of South European Russia [ggr] tend to overlap. Here, the cropland acreage of collective farms results in an average ratio of only eight or nine acres per family. It is only in Central Asia [ggr] and the Transcaucasus [ggr], where irrigation and substantially improved temperature conditions allow for pockets of intensive specialty crop agriculture, that even lower average ratios of five to seven acres prevail. Obviously, the average productivity of Soviet cropland as a whole will be strongly conditioned by the proportion of the total arable land resource falling within each of the foregoing zones. The same, of course, will apply to North America.
DETERMINANTS OF LAND PRODUCTIVITY
A variety of factors, both human and physical, contribute to spatial variations in the productivity of agricultural land. The average returns per acre in any region or country will be conditioned as much, or more, by the combination of crops produced as by the specific level of yields attained for an individual crop such as wheat. Variations in returns per acre, depending on the type of crop produced, normally exceed by a substantial margin areal [specific regional] variations encountered in the yield of any
3/4
single crop. In the USSR, for example, the average value of production per acre from land devoted to cotton, or to potatoes and vegetables, is about twelve times the national average for grain crops. Sugar beets have a return, on the average, about eight times and sunflowers three to four times that of grain,5 Average yields for almost all crops are higher in Canada and the United States than in the USSR, but the relative range in monetary returns for different crop types is closely comparable. Minor variations in the scale can be attributed to the climatic or other conditions, such as irrigation, under which individual crops are grown in the three countries, and to slight differences in relative price structures.
Climatic and market factors are the principal determinants of the combination of crops and other agricultural products that will be produced in any given area. Although terrain conditions will affect substantially the areal extent of the arable land resource, landforms and soil types are not likely to play a significant role in the actual use made of the tillable land, particularly at the broad regional or national level. The worst land, in terms of slope, drainage, and soil texture, will have been excluded from the cropland resource.
The Market Factor
The market may be said to influence land use intensity at the local, regional, and national levels. At the local level there is the classic Von Thunen pattern, with market gardening and other high value uses tending to concentrate in the shadow of a major urban centre. Substantial regional differences in the density of population relative to the land resource will affect the average intensity of land use on a broader scale. The concentration of the consumer market in the northeastern United States increases the spread in average returns per acre between this area and the inherently less productive land of the Great Plains, and reduces the gap in average returns per acre relative to the thermally more favourable agricultural lands of the southeastern region. However, in the present analysis we are more concerned with the effect of the market factor on land use intensity at the national level and the extent to which this could distort a comparison of average land productivity in the USSR and North America.
Considering all factors, it is reasonable to conclude that market conditions have roughly the same effect on land use intensity for the USSR as a whole as they do for North America. Since the total population and acreage of cropland for the Soviet Union and North America are almost equal, the pressure to find the highest intensity use for each unit of land will be generally comparable. The total acreage devoted to vegetables other than potatoes, for example, is about the same in both areas. Some allowance should be made for reduced market pressure in comparing the productivity of Canada's cropland with that of the United States or the USSR. Prairie agriculture is undoubtedly less intensive than would be the case if cropland ratios per capita in Canada approximated those of the United States and the Soviet Union. However, Canada's contribution to North America's farm output is so small that the general statement regarding the role of the market in the Soviet Union and North America applies also to a more restricted comparison of the USSR and United States.
The above conclusions are of course subject to certain reservations. Differences
4/5
in market pressure have had some effect on the use of the arable land resource in the USSR relative to that of North America. In particular, the Soviet Union, with a poorer quality cropland base to feed its population, has not found it expedient to devote as large a share of its arable land to fallow. In this sense, the market factor has contributed to an increase in land use intensity at the national level. Reference should also be made to the basic difference in the orientation of the farm economy. The USSR has not been able to afford the luxury of converting so high a share of its crop production into livestock products as is the practice in North America. The inefficiency of the conversion process, involving the loss of a substantial fraction of the initial food value, has forced the Soviet Union to rely more on the production of food crops, such as potatoes and wheat, intended for direct human consumption than on crops destined for use as livestock feed. However, the losses involved in the conversion process are reflected in the higher monetary values of livestock products. Since land productivity is being measured and compared on the basis of monetary value, the basic difference in the orientation of the Soviet farm economy, with its emphasis on food crops, and the American, with its emphasis on feed crops, for the purpose of this paper, can be safely ignored.
The Climatic Factor
Climate is without question the major factor contributing to broad regional gradients in the productivity of the arable land resource within both the USSR and North America. Spatial variations both in the yield of individual crops and in the over-all crop composition, or type of farming, are closely related to differences in thermal and moisture conditions. Up to a point, all crops show higher returns as moisture conditions improve. The more intensive and higher value crops are equally sensitive in terms of their thermal requirements, the potato being the most notable exception to the general rule.
The combined effect of the moisture and temperature factors on crops yields and crop composition in the USSR is illustrated in Table II with reference to sugar
TABLE II
relationship between
crop distributions and yields in the USSR*
Sugar
Beets
Sunflowers
Grain
Corn
Region
Average Yield (USSR = 100%)
% of Total Crop Acreage
Average Yield (USSR
= 100%)% of Total Crop Acreage
Average Yield (USSR = 100%)
% of Total Crop Acreage
West Ukraine
East Ukraine
Central Chernozem [blacksoil]
Central
Volga
Western Siberia
121
105
82
49
51
38
9.0
4.0
7.0
1.0
1.0
0.4
107
123
83
52
31
1.0
8.0
5.0
3.0
0.2
130
98
74
70
45
45
3.00
8.00
1.00
0.00
0.03
0.00
The areas used in the table represent a selection of the official economic planning regions of the USSR, the West Ukraine being the Southwest Region and the East Ukraine the Donets-Dnepr Region. The yields of sugar beets and sunflower are ten-year averages (1954-63), while the yield of grain corn is a four-year average (1962-65). The percentage of the regional crop acreage devoted to each crop is based on the crop composition in 1965. The figures in the table have been calculated from statistics taken from the 1963, 1964, and 1965 editions of the statistical yearbook of the USSR (Narodnoe Khoziaistvo SSSR) and the 1965 statistical yearbook of the RSFSR.
5/6
beets, sunflowers, and grain corn. All three crops could be described as falling into the high value category in the sense that, given suitable climatic conditions, they will produce higher returns per acre than wheat. In the table average yields per acre for a series of representative regions have been expressed as a percentage of the average national yield for each crop. Generally speaking, as yields decline, so also does the share of each crop in the total crop acreage. The relatively low fraction of the crop area devoted to corn in the West Ukraine, where yields are at a peak, can be attributed to the peculiarities of the regional units used in the analysis. The corn belt does not extend into the more northerly parts of this region. As temperature and soil conditions deteriorate to the north, potatoes, flax, and rye replace the corn, sugar beet, and winter wheat combination of the south.
The decline in the yield of sugar beets between the western and eastern sectors of the Ukraine can be attributed primarily to the moisture factor. The effect of temperature can be seen most clearly in the marked deterioration in the yield of all three crops with a northward progression through the Central Chernozem Region to the Central Region around Moscow. The extremely low yields in the Volga Region and Western Siberia are partly a function of temperature and partly a function of moisture conditions. In West Siberia the per acre returns are barely one-third those of the centres of sugar beet, sunflower, and corn production in the Ukraine.
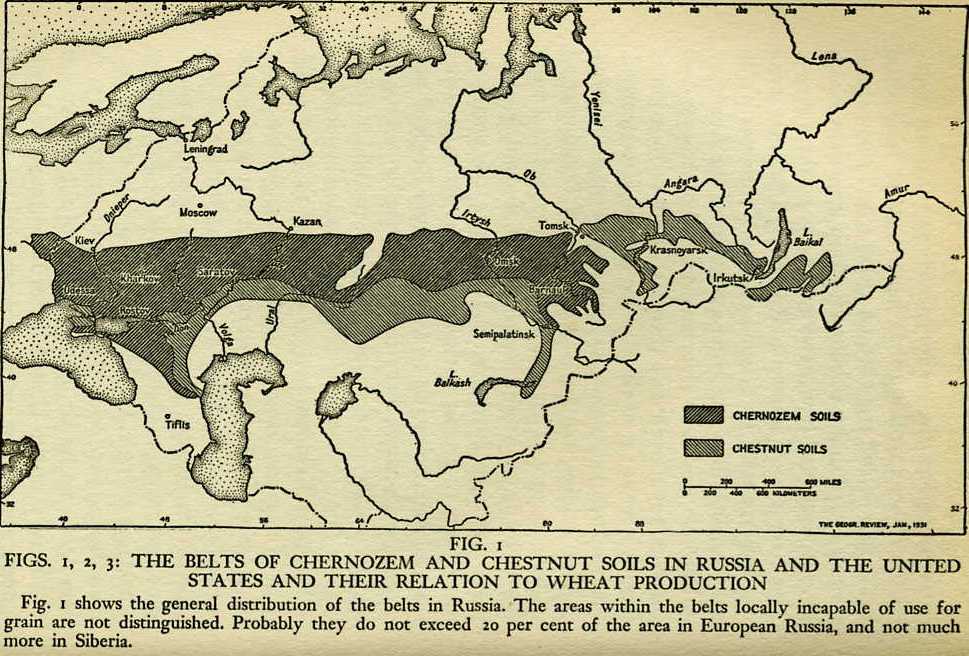
Thermal conditions, then, must be weighted almost as heavily as moisture conditions in evaluating the quality of the agricultural environment. As noted previously, cropland ratios per farm family demonstrate that the wooded steppe and steppe regions of South European Russia in terms of land productivity equate much more closely with the humid, but cooler, forest lands to the north than they do with the eastward extension of the grassland soil and vegetation belts between the Volga and Yenisey. For the same reason, we cannot assume that soil and vegetation alone will provide a reliable index of environmental quality in comparing the Soviet steppe with the Great Plains of North America.
THE CLASSIFICATION SCHEME
The agricultural environments of the USSR and North America have been divided into twelve types based on three thermal classes and four moisture classes. The climatic thresholds used in the classification scheme are those considered by the author to be most significant in an analysis of crop patterns and yields.
Thermal Classes
Although certain crop distributions such as winter wheat and tender fruits can be related more directly to winter temperatures, thermal conditions during the growing season are of greater concern in the production of most agricultural commodities. Thermal classes have been defined on the basis of accumulated summer temperatures measured in terms of degree-months (the sum of mean monthly temperatures in excess of 32°F.).6 The three classes employed are: 100-199, 200-299, and 300 plus degree-months.
In both Canada and the USSR the northern margin of significant agricultural settlement corresponds closely with an isoline of about 120 to 130 degree-months
6/7
Values in this range are typical of the prairie pioneer fringe, the clay belt of Northern Ontario and Quebec, the northern margin of close agricultural settlement in European Russia, and the zone bordering the Trans-Siberian Railroad [ID] across West Siberia. The 200 degree-month threshold between the lower and middle thermal classes corresponds with the approximate northern limit of the zone in which corn can be expected to mature as a grain crop. It also serves as a desirable lower threshold for the sunflower, sugar beet, and a number of other intensive or semi-intensive crops. Although some of these crops, such as the sugar beet, may be grown fairly extensively in areas in the 170-200 degree-month range, the penalty is substantially reduced yields. In the United States the 200 degree-month isoline bisects South Dakota in the west, continuing eastward through southern Minnesota, Wisconsin, and Michigan. The northern part of New England also lies to the north of this line. Few areas in the United States, however, have values of less than 175 degree-months. In Canada, on the other hand, almost all of the Prairies, the Atlantic provinces and parts of southern Quebec are characterized by accumulated temperatures of less than 175 degree-months and only the extreme southwestern corner of Ontario and parts of British Columbia exceed the 200 degree-month threshold. In southern Ontario values decline from a maximum of about 210 degree-months in the corn belt of the extreme southwest to 200 at Toronto and 175 at Ottawa. In the Soviet Union, outside of Central Asia and the Caucasus, only the southernmost part of the Ukraine and adjacent lowlands north of the Caucasus have accumulated temperatures exceeding the 200 degree-month level. The southern fringe of the Ukraine, bordering the Black Sea, is comparable in terms of summer temperature conditions to the southern half of South Dakota. The Soviet area, however, is favoured by a somewhat milder winter, placing it in a winter wheat rather than a spring wheat belt.
The 300 degree-month threshold dividing the middle and upper thermal classes marks the approximate northern limit of cotton cultivation in the USSR. In North America cotton is not grown under as hazardous thermal conditions and is confined to the area south of the 350 degree-month line. In the eastern United States the zone with accumulated temperatures exceeding 300 degree-months includes Virginia and all states to the south. Further west the 300 degree-month line forms the approximate boundary between Kansas and Oklahoma and, on the Pacific littoral, between Oregon and California. In the USSR only the lowlands of Central Asia and the Caucasus have degree-month values exceeding 300. The maximum values of about 350 in the southern fringe of Central Asia fall far short of the 400-500 degree-month range characteristic of Florida and the American Gulf Coast. Southern Kazakhstan, which forms the northeastern sector of the irrigated farming region of Central Asia, has accumulated temperatures comparable to those of southwestern Ontario, placing it far outside the thermal limits of the cotton belt.
Moisture Classes
To assess the moisture factor solely on the basis of annual precipitation would be misleading, since water need is significantly greater in the United States due to higher temperatures than it is throughout most of the agricultural regions of Canada and the USSR. Moisture conditions have therefore been measured in terms of the water balance based on the Thornthwaite formula.7 Four moisture classes have
7/8
been defined in terms of the proportion of water need, or potential evapotranspiration, which is satisfied through actual evapotranspiration. The classes cover the following ranges: 90-100 per cent, 80-89 per cent, 65-79 per cent, and 0-64 per cent.
The first class, in which actual evapotranspiration is equivalent to 90 per cent or more of the water need, equates with the forest vegetation zones where moisture deficiency is of minor significance to land productivity. In the United States the 90 per cent line runs from north to south and lies very close to the eastern edge of the Dakotas. Further south the 90-100 per cent zone includes the eastern fringe of Nebraska, Kansas, Oklahoma, and Texas, with the western boundary running approximately through Houston. In the USSR the 90 per cent line corresponds closely with the transition from forest to wooded steppe and trends from southwest to northeast across the European plain between the Carpathians [ggr] and the Urals [ggr].
The second class, in which 80-89 per cent of the water need is covered through evapotranspiration, could be described as subhumid. It includes only the moister segments of the black or chernozem soil zone and equates fairly closely with the parkland or wooded steppe vegetation belt. The third class, in which actual evapotranspiration covers 65-79 per cent of the water need, includes the remainder of the black soil zone as well as areas with conditions comparable to the dark brown soil belt of the Canadian Prairies. The final class, in which actual evapotranspiration amounts to less than 65 per cent of the potential need, includes all those areas ranging from extremely dry steppe down to desert conditions. The dry belt, or brown soil zone, of southeastern Alberta and southwestern Saskatchewan is characterized by values in the 55-64 per cent range. The extreme lower limit under which dry farming can be practised would appear to be a value of about 45-50 per cent, but irrigated agriculture frequently extends into the 50-64 per cent zone. For this reason areas suited only for irrigated farming have been grouped in the cropland inventory with the very marginal dry farming areas.
To illustrate further the classification scheme, specific thermal and moisture ratings for a representative group of Soviet and North American stations are listed in Table III. Although a few areas have slightly higher ratios, moisture conditions in the dry farming regions of North Kazakhstan generally range between those at Omsk [ggr] and the extreme margin typified by Semipalatinsk [ggr].
TABLE III
thermal and moisture ratings for selected stations
(“Rate” is determined by dividing AE by PE times 100 *
DM = Degree-Months)
|
|
|
|
|
||
|
Moscow |
150 |
92 |
Sault Ste. Marie, MI |
146 |
96 |
|
L'vov (W. Ukraine) |
192 |
97 |
Toronto, Ontario |
200 |
94 |
|
Kharkov (E. Ukraine) |
175 |
83 |
Des Moines, IO |
246 |
95 |
|
Saratov (Volga) |
187 |
62 |
Pierre, SD |
212 |
63 |
|
Rostov (Lower Don) |
210 |
66 |
North Platte, NE |
227 |
69 |
|
Odessa (S. Ukraine) |
219 |
57 |
Denver, CO |
223 |
55 |
|
Novosibirsk (W. Siberia) |
128 |
81 |
Edmonton, Alberta |
140 |
82 |
|
Omsk (W. Siberia) |
133 |
60 |
Regina,Saskatchewan |
150 |
70 |
|
Semipalatinsk(N.Kazakhstan) |
170 |
44 |
Medicine Hat, Alberta |
177 |
54 |
*Actual evapotranspiration [AE] expressed as a percentage of potential evapotranspiration [PE].
AN INVENTORY OF THE CROPLAND RESOURCE
The cropland resources of North America have been classified by county in terms of the thermal and moisture classes into which they fall. Totals have been derived for Canada and the United States both separately and combined. Similar totals have been calculated for the Soviet Union employing cropland data reported for approximately 150 oblasts and comparable territorial divisions.8 Since the areal units used in the USSR were larger in size, it was necessary in some cases to apportion the cropland resource of a territorial division amongst two or more climatic classes. Problems of classification arise too in the Pacific region of North America and areas of comparable topographic diversity in the Soviet Union where thermal and moisture conditions change markedly over short distances in response to variations in altitude. Estimates regarding the distribution of cropland have also had to be made in these areas. The total apportioning of the arable land resource amongst climatic classes must therefore be regarded as an approximation. However, the range of error is believed to be small. The results of the analysis are presented in Tables IV and V. Most of the figures in both tables have been rounded to the nearest whole number.
The marked contrast in the distribution of the agricultural land resources of the USSR and North America with respect to the twelve zones of varying environmental quality is clearly demonstrated in Table V, in which the distributional patterns have been expressed in percentage terms. The reader's attention is directed, in particular, to the totals for the three vertical thermal class columns and the four horizontal moisture class rows. In the USSR four-fifths of the cropland falls within the least productive thermal zone, with less than 200 degree-months, whereas the proportion for the United States alone is not more than one-fifth and even for Canada and the United States combined only about one-third. With respect to moisture conditions, approximately 60 per cent of the Soviet arable land base is encompassed by the two least favourable classes, in which moisture deficiency markedly limits land productivity. The proportion for Canada and the United States together is only about 40 per cent and for the United States alone about one-third. The bottom moisture class, which embraces only the most marginal of the dry farming areas together with arid lands where crop production is impossible without irrigation, includes almost 200 million acres of the Soviet Union's cropland resource. And of this total, only 23 million acres or 12 per cent is irrigated. In Canada and the United States approximately 100 million acres, or little more than one-half as much cropland, falls into this class and at least one-third is subject to irrigation. The arable land base of North America as a whole, and that of the United States in particular, is thus much more favourably endowed from the standpoint of environmental quality than that of the Soviet Union. Canada's land resource, on the other hand, is of even lower average quality than that of the USSR. One important reservation, however, should be noted. Although a somewhat larger share of Canada's arable land falls within the two lowest moisture classes than is the case with the USSR, Canada's grainlands are largely concentrated within the third class in which precipitation is sufficient to cover two-thirds to four-fifths of the annual potential evapotranspiration. In the Soviet Union a much higher
TABLE IV
cropland
classified by thermal and moisture zones
(millions of acres)
(For calculation of RATE, see TABLE III just above)
|
|
CANADA |
UNITED STATES |
CANADA & UNITED STATES |
USSR |
||||||
|
RATE as % |
Degree-Months |
Degree-Months |
Degree-Months |
Degree-Months |
||||||
|
100-199 200-299 300+ Total |
100-199 200-299 300+ Total |
100-199 200-299 300+ Total |
100-199 200-299 300+ Total |
|||||||
|
90-100 |
23 1.70 25 |
35 135 |
84 |
254 |
58 137 |
84 |
279 |
148 0.5 |
1.7 |
150 |
|
80-89 |
10 10 |
10 21 |
11 |
42 |
20 21 |
11 |
52 |
82 6.0 |
|
88 |
|
65-79 |
50 0.05 50 |
24 29 |
16 |
69 |
74 29 |
16 |
119 |
103 32.0 |
|
135 |
|
0-64 |
18 18 |
18 29 |
36 |
83 |
36 29 |
36 |
101 |
123 50.0 |
20.0 |
193 |
|
total |
101 1.75 103 |
87 214 |
147 |
448 |
188 216 |
147 |
551 |
456 88.0 |
22.0 |
566 |
TABLE V
cropland
classified by thermal and moisture zones
(percentage distributions)
|
|
|
|
|
|
||||||
|
RATE as % |
Degree-Months |
Degree-Months |
Degree-Months |
Degree-Months |
||||||
|
100-199 200-299 300+ Total |
100-199 200-299 |
300+ |
Total |
|
100-199 200-299 300+ |
Total |
|
100-199 200-299 300+ |
Total |
|
|
90-100 |
22 2 24 |
8 30 |
19 |
57 |
|
10 25 15 |
50 |
|
26 0.1. 0.3 |
26 |
|
80-89 |
10 10 |
2 5 |
2 |
9 |
|
4 4 2 |
10 |
|
14 1.0 |
15 |
|
65-79 |
48 48 |
5 7 |
3 |
15 |
|
13 5 3 |
21 |
|
18 6.0 |
24 |
|
0-64 |
18 18 |
4 7 |
8 |
19 |
|
7 5 7 |
19 |
|
22 9.0 4.0 |
35 |
|
total |
98 2 100 |
19 49 |
32 |
100 |
|
34 39 27 |
100 |
|
80 16.0 4.3 |
100 |
10/11
proportion of the cropland in the grassland zones falls within the bottom class, which equates with the highly marginal Canadian dry belt or short-grass prairie.
Finally, the attention of the reader must be directed to the slots in the table encompassing the two most favourable moisture classes in the 200-299 degree-month thermal column. Herein lies the corn belt environment of North America, embracing 35 per cent of the arable land resource of the United States and almost 30 per cent of that of Canada and the United States combined. Barely one per cent of the Soviet Union's cropland falls within this sector of the table and almost all of this fits into the second, or subhumid, moisture category. Moreover, virtually all of this land grades towards the lower threshold of the thermal class and compares more closely, in terms of accumulated summer temperatures, with the northern margins of the North American [grain] belt than it does with the central core. It is not surprising, therefore, that the average yield of grain corn in the Ukraine in recent years has been only about 35 bu. per acre, in contrast to a national average of 55-60 bu. per acre for the United States and 70 bu. for the state of Iowa. The average yield for the state of South Dakota, in which accumulated summer temperature conditions equate much more closely with those of the Soviet [grain] belt, has been almost identical with that of the Ukraine. One must be equally cautious in attributing largely to the human factor differences in the per acre returns for other crops. The average yield of sugar beets in southwestern Ontario, for example, has been roughly double that of the Soviet sugar beet belt centred on the wooded steppe vegetation zone of European Russia. However, average returns for sugar beets in the Manitoba lowlands, which are more analogous in terms of moisture and/or thermal limitations to the Soviet region, have only moderately exceeded the returns in the USSR.
Conclusions
It is evident from the foregoing analysis that environmental quality must be weighted heavily in assessing the relative productivity of the agricultural land resources of the Soviet Union and North America. That technological factors also contribute to the differences cannot be denied. This is particularly clear in the case of the potato which plays so important a role in the Soviet farm economy. The average yield in the mixed forest vegetation belt of European Russia is only about 40 per cent of the prevailing level in North America. Little, if any, of this difference can be attributed to environmental impediments. One has only to return to the 1920s and 1930s to find average potato yields in North America at least as low as those currently recorded in the USSR. Average yields for this crop in North America have tripled over the past several decades in response to heavy fertilizer inputs. Soviet potato yields, on the other hand, have risen not much more than 10-15 per cent over the last half-century. Substantially increased fertilizer input appears to have been concentrated on cash crops such as cotton, rather than on the potato which is consumed to a greater extent on the farm and which serves, in part, as a livestock feed. In terms of the climatic factor there seems to be little reason why potato yields in the Soviet Union could not be pushed to a level comparable to that of North America. The environmental impediment with respect to most other crops, however, is much more serious. Given equal technology and
11/12
capital inputs the Soviet Union can never hope to achieve, in the author's view, an average level of productivity from its cropland resource approaching that of the United States or the North American region as a whole. Per acre returns on both continents can be expected to rise in absolute terms, and the Soviet rate could conceivably exceed that in North America. However, it is unrealistic to expect technological advances in the USSR, any more than in Canada, to reduce markedly the productivity gap between its agricultural land resource and that of the United States.
To assess more precisely how far human rather than environmental factors have limited Soviet agricultural output in comparison with that of North America, it is essential that detailed studies focus on the returns derived from arable land in restricted zones of analogous environmental quality. In other words, environment must be eliminated as a variable in order to measure the effect of other factors. A second, more comprehensive, approach to the problem might also be suggested. A quantitative measure of the distribution of cropland relative to zones of varying productive potential has been presented in this paper. The next stage in the analysis could involve an attempt to rate, on the basis of monetary returns, the productive potential of land in each climatic zone. The average value of farm products sold per acre could be calculated from census data for the cropland falling into each of the twelve categories in the United States table. The weights derived could then be applied to the table for the USSR to determine the total agricultural output, or average national output per acre, which might be expected from the Soviet cropland resource if technology were on a par with that of the United States. Ideally, the ratings for the United States regions should make allowance for regional differences in the double counting of agricultural products associated with the purchase of feed and livestock. In applying the United States scale of environmental ratings to the USSR, it would be difficult to allow for those differences in land use intensity and productivity at the broad regional level which can be traced to market pressures. The pattern of population distribution relative to cropland and environmental zones in the two countries is not identical. At the same time, the largest consumer market is at least concentrated in the more humid regions in both nations, and this would reduce the distortion. It is doubtful, moreover, that market factors would account for a very significant share of the broad regional differences in the average intensity of land use throughout the United States. Income per acre of cropland in Ohio, for example, would still exceed substantially that in North Dakota if population were more equally distributed between the Northeast and the Great Plains.
Although the analytical problems are complex, further research along the lines suggested should prove rewarding. Not only would it contribute to a better understanding of the physical and human problems facing the Soviet Union in the management of its land resource; it would also provide a comparative base for measuring and evaluating the quality of agricultural land resources in still other parts of the world.
REFERENCES
1. The 70-75 per cent figure is the official Soviet estimate and must be viewed as no more than an approximation. Narodnoe Khoziaistvo SSSR v 1965 g. (Moskva, 1966), p. 85. The method employed in calculating the relative agricultural output of the USSR and
12/13
United States is not explained. The extent to which double counting of agricultural products such as livestock feeds has been avoided is not known. The percentage relationship, moreover, would vary at least moderately depending on the price system used in the calculations. For example, if there were a greater spread between the price of a pound of wheat and a pound of meat in the Soviet Union than in the United States, the latter, with a greater emphasis on meat production, would show up better if Soviet prices were used to calculate the comparative output of all farm commodities in the two countries. The USSR, under the same conditions, would have an agricultural output closer to that of the United States if the latter's prices were employed. The calculated spread in the relative industrial production of the two nations varies substantially, depending on whether rouble or dollar values are used in the analysis. This can be attributed to the combined effect of an unusually heavy emphasis on producers' goods in the Soviet industrial economy and to the artificially high prices which have been set for consumers' goods. Although the farm economies of the two nations also differ in terms of the relative emphasis on specific products or groups of products, there is little evidence to suggest that the price structures vary as greatly or as consistently as they do in the industrial sector. For the purposes of this paper, where an approximation will suffice, the Soviet estimate of relative output would appear adequate.
2. With a cropland base almost one-quarter as large as the United States, the total value of farm products sold by Canadian farmers is not quite one-tenth that of their American counterparts. In fact, both California and Iowa have a farm income not substantially below that of Canada as a whole. Even without adjusting for the lower value of the dollar, income per acre in Canada has averaged less than half the United States level. On the other hand, if American farm commodity prices were employed to calculate Canada's agricultural output, and if allowance were made for a higher rate of double counting of agricultural commodities in the American farm economy in the form of purchased feed and livestock, the spread in agricultural output would be somewhat reduced. It is unlikely, however, that the productivity of Canada's arable land relative to that of the United States would exceed the 50 per cent level suggested in this paper.
3. The relative productivity of Canada's agricultural land resource would compare more favourably with that of the Soviet Union if agricultural output were calculated per acre of land actually devoted to crops rather than per acre of cropland. In Canada over 35 per cent of the cropland recorded in the 1961 Census was devoted to fallow and improved pasture. In the Soviet Union only about 10 per cent of the cropland is so used. In the United States the proportion in 1959 was about 30 per cent. Although seeded pasture might be viewed as a crop comparable to hay, fallow contributes only in a very indirect sense to agricultural output. Mention should also be made of the fact that comparisons of land productivity in this paper are based on the relationship between agricultural output and the cropland resource, without allowance for differences in the acreage of natural pasture land employed in the farm economy. It is impossible to isolate that fraction of agricultural output that is derived from lands in the latter category, but it would not be substantial. Moreover, as noted in the introduction, the total acreage of unimproved grazing land employed by collective and state farms in the USSR is fairly comparable to the combined total for the United States and Canada.
4. The ratios have been calculated by dividing the total arable acreage in collective farms, including land in private garden plots, for each of the official economic planning regions of the USSR by the total number of collective farm households reported for each region. The data are for 1964 and are derived from statistics in Narodnoe Khoziaistvo SSSR v. 1964 g. (Moskva, 1965), pp. 264, 402. Similar ratios can be calculated for the state farm sector by dividing the arable acreage or sown crop acreage on state farms by the number of state farm workers. Unfortunately, published data on state farm acreages and work force are not always broken down regionally for the same years. For a more detailed table of regional variations in the ratios for both collective and state farms see field, N. C., "Land Hunger and the Rural Depopulation Problem in the USSR, Annals Assoc. Am. Geog., L, 4 (1963), 470.
5. The average value of production per acre has been calculated from data in Narodnoe Khoziaistvo SSSR v 1964 g. (Moskva, 1965), pp. 255, 257. Prices per ton for each commodity have been determined and averaged for the three-year period, 1962-64, by dividing payments by the state for its purchases by the total tonnage bought. The prices have then been related to the average national yields for each crop for the same period to obtain value of production per acre.
13/14
6. Although an impressive array of maps and texts have been published on the climate of the USSR, there is still not available in the West a comprehensive up-to-date list of monthly temperature and precipitation means for stations throughout the Soviet Union, Pre-1930, and in some cases pre-1914, means for a large number of locations can be found in: air ministry, meteorological office, Tables of Temperature, Relative Humidity and Precipitation for the World, Parts III and V (London: Her Majesty's Stationery Office, 1958). The values reported in this source have been used as a base in calculating degree-months. They have been supplemented, wherever possible, with data published for selected stations in recent Soviet texts.
7. Water balances have been obtained for a large number of stations from: C. W. thorn -thwaite associates, laboratory of climatology, "Average Climatic Water Balance Data of the Continents, Part III—U.S.S.R.; Part VI—North America (excluding United States); Part VII—United States," Publications in Climatology, XVI, 2 (1963); XVII, 2 (1964); and XVII, 3 (1964). The water balances are based on the more complex system of soil storage accounting introduced by the Thornthwaite Laboratory in 1955. Relative to the grasslands of North America, moisture conditions in the Soviet steppe appear somewhat less severe when the moisture balance is based on the 1955 system than on the older and less sophisticated procedure in which the average soil was assumed to be capable of releasing only 4 inches of stored winter precipitation for use during the subsequent growing season. Precipitation in the Soviet steppes, particularly those of the European USSR, tends to be less concentrated during the growing season than in the Great Plains of North America. An area with an average annual precipitation of 16 inches in the Canadian Prairies would receive only about 4 inches during the coldest six months of the year, when there is little or no evapotranspiration, whereas an area in European Russia with the same total precipitation would receive 6 or 7 inches of it during this period. Under the old soil storage accounting procedure, several inches of the Soviet precipitation were assumed to be wasted and to contribute to stream flow. Under the new system withdrawals from storage are generally sufficient to make use of all of the winter precipitation falling on the Soviet steppes. An examination of stream runoff maps for the USSR and North America, as well as the boundaries between forest, wooded steppe, and steppe vegetation belts in the USSR and Canada, suggests to the author that the refined 1955 system may not provide as accurate an index of moisture conditions as the older and simpler system based on a four-inch storage capacity. However, a definitive conclusion must await more detailed investigation. For the purposes of this study the newer system has been accepted. To the extent that it may overrate the carryover of winter precipitation in certain areas, it would tend to err most frequently in favour of the Soviet Union.
8. Cropland distributions in the United States and Canada are based on the 1959 and 1961 agricultural censuses of the two countries. The Soviet distributions have been derived from statistics in the following sources: Narodnoe Khoziaistvo RSFSR v 1965 g. (Moskva, 1966), pp. 188-9, 227-29; Narodnoe Khoziaistvo SSSR v 1965 g. (Moskva, 1966), pp. 280, 349-50; Sel'skoe Khoziaistvo SSSR; Statisticheskii Sbornik (Moskva, 1960), pp. 500-3.
|
|
|