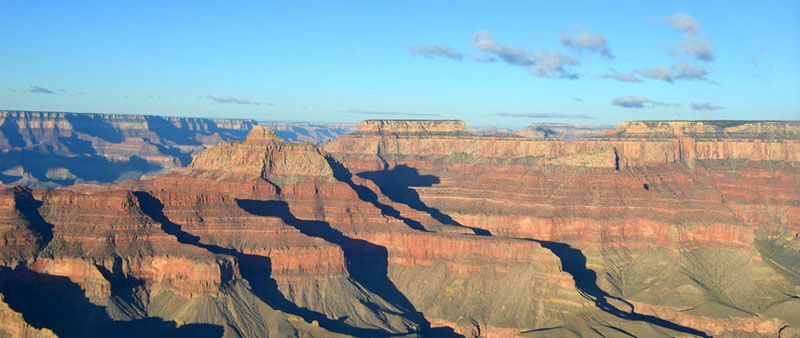
The above photo is distributed for public domain use by the Grand Canyon NPS, and can be found here.
(A) Course Syllabus and Logistics
(B) Why are sediments preserved? What is the basic significance of any stratigraphic section?
Basically, we need a hole or space for sediments to pile up. Some of this space can be created by seal-level rise, but any thick section of sediment requires creation of vertical "accommodation space" (we will get into this in more detail later in the quarter). We call the "hole" a sedimentary basin. Preservation of sediments through time results from the interaction of several key processes: basin subsidence (+/- sea level rise) and sediment input. Changing the sign on these processes (ie. uplift or sea level fall) will affect the rate of deposition and may lead to erosion or nondeposition. Repeating the cycle of deposition and erosion will produce unconformities, and the stratigraphic record is produced.
The study of Sedimentology allows us to understand the composition and origin of the sediments, as well as the underlying processes of sediment transport and deposition. Studying the Stratigraphy of the rocks tells us when, where and how fast the sediments accumulated, and how things like depositional environments, sea level, tectonics, and climate changed through time.
The above photo is distributed for public domain use by the Grand Canyon NPS,
and can be found here.
The Grand Canyon demonstrates the pronounced contrast between accumulation of sediment during Paleozoic time, versus pronounced erosion that is taking place on the Colorado Plateau today. So we can ask:
Reading: Global Cycles Web Page, by Paul Olsen, LDEO
A. Water: the most important global cycle affecting Earth's surface. The hydrologic cylce is driven by a large scale imbalance between precipitation and evaporation: (1) Over the oceans, evap > precip; (2) Over the continents, precip > evap (see graphic below). This imbalance results in continuous runoff of rivers to the oceans. Therefore, rivers play a major role in transporting chemical elements, nutrients, and sediments from the continents to the oceans.
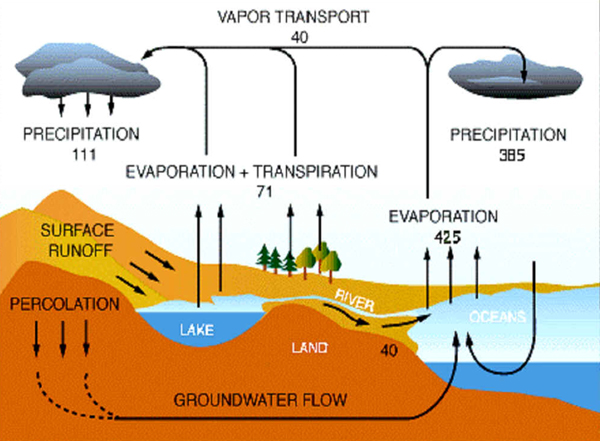
Above image is from the web site "The
Global Water and Nitrogen Cycles", University of Michigan.
Also see a nice summary and graphics describing the hydrologic cycle (Encyclopedia of Earth).
B. Oxygen and Carbon: closely interconnected via photosynthesis and respiration.
Major sources of atmospheric CO2 include: (1) volcanism at subduction zones and mid-ocean spreading centers, (2) respiration (mainly by animals), and (3) burning of fossil fuels.
Major sinks of carbon (where carbon is trapped and stored): (1) photosynthesis, (2) chemical weathering of rocks, (3) sediments (coal, oil, and limestone).
Check out the KEELING CURVE, an important record of atmospheric CO2 over the past 800,000 years to the present.
C. The Rock Cycle: transfer of material between continental
crust, ocean crust, and mantle. Plate tectonics play a major role in driving
the rock cycle (see Paul Olsen's Global Cycles web page). Large rivers are also
important for moving crust (in the form of sediments) from continents to the
oceans.
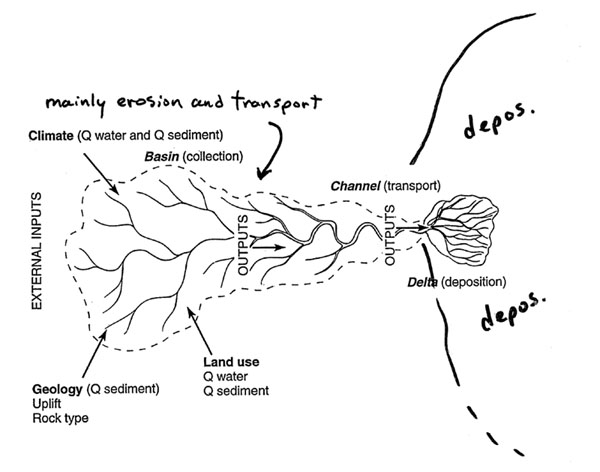
* Drainage Basin = the drainage network of a river system. Generally defined as an area of erosion and transport, but often includes local areas of fluvial deposition and/or temporary sediment storage.
* Sedimentary Basin = a low-lying physiographic area of sediment deposition and accumulation. Includes lakes, low-energy rivers, estuaries, marine coastlines, continental shelves, deep oceans, etc. There are a variety of geological and tectonic processes that lead to crustal subsidence, which in turn produces sedimentary basins.
* Calculating Rates of Annual Sediment Discharge and Vertical Denudation.
Using some simple techniques and calculations, it is possible to calculate the volume of sediment that leaves a river's drainage basin over a given period of time. This involves making direct measurements and extrapolating them to longer periods of time. For example, it is common to measure sediment discharge once a week or once a month for a year, and assume that these measurements are representative of discharge on the days that we didn't measure it. By doing this we can estimate, with some confidence, the total volume of sediment that was transported out of the river system (past the point of measurement) in one year. It is important to measure discharge during flood events, since most sediment movement occurs during floods.
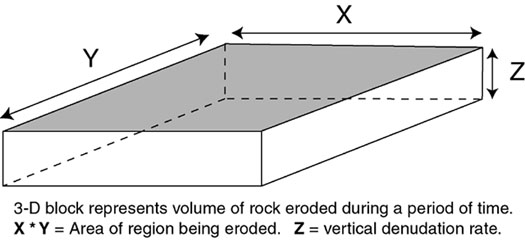
The diagram above, although highly simplified, shows how we can relate volumetric sediment discharge to vertical denudation rate. Once we have determined the volume of sediment transported past the mouth of a river during one or more years, we can calculate the average annual sediment discharge (by volume) for the river. Note that the volume of sediment removed in a year is equivalent to X * Y * Z in the diagram above. We then measure the map area of the drainage basin (catchment) for the river, which is represented by X * Y. From this we can say that, averaged over the area of the drainage basin, the vertical erosion rate (denudation rate) is equal to Z. Z = (XYZ) / (XY), per year.
How do we measure sediment discharge? Below I explain a method that is commonly used to do this.
(1) First we measure water discharge, knowing that the water contains some sediment which is carried in the suspended load. Water discharge is a rate measured as volume per unit time; it is obtained by measuring the velocity of the water and multiplying velocity times the cross-section area of the channel.
(2) Next we measure the suspended sediment concentration of the water, commonly in units of grams per liter (g/L) or milligrams per liter (mg/L). We use simple math to combine all the weekly or monthly measurements of water discharge and sediment concentration, and extrapolate them through time to determine the total mass of sediment (in grams or kilograms) that is transported through the river in one year.
(3) Then we convert mass to volume, assuming a given density (usually 2.65 g/cc). This calculation does not include porsity (space between grains), because here we are looking for the equivalent solid volume of bedrock material that is removed from the drainage basin by erosion.
(4) In some cases we know about how much sediment (by percent) is transported in the suspended load versus bedload in a particular river. If this infomration exists, we adjust the number from step 3 upward, by the approriate fraction, to obtain a better estimate of the total volume of solid sediment moving through a river system.
(5) The final step is illustrated in the diagram above. Divide the total volume of material eroded during one year in a river drainage basin by its area. This gives the vertical erosion rate (denudation), in units of length per time, averaged over the area of the drainage basin. This rate is commonly given in units of mm/yr. Obviously, erosion rates are not the same in all parts of most drainage basins, so the average value that we calculate here is only an average. If you wanted to understand variations in erosion rates in different parts of a drainage basin, you would have to do these kinds of measurements and calculations at a number of locations in the river system, in order to break it down into smaller areas.
We worked an example of these calculations in class, using real numbers from the Columbia River (shown below). The first homework involves similar calculations for the Mississippi and Ganges-Brahmaputra Rivers.
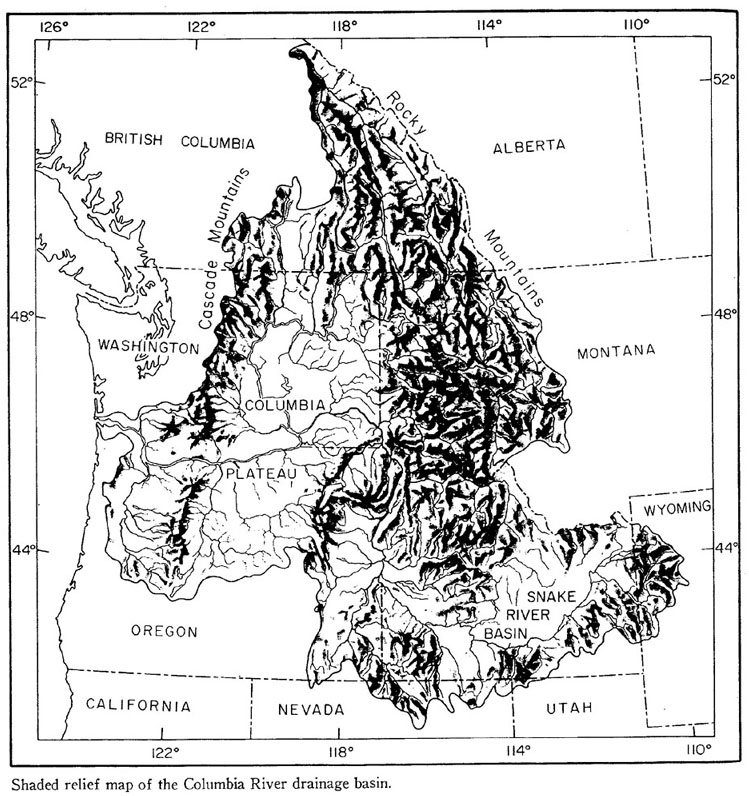
Above map is from J.T. Whetten et al. (1969), Characteristics of Columbia River
sediment and sediment transport, published in the Journal of Sedimentary Petrology,
v. 39, p.1149-1166.
Return to Lecture Outlines