|
An Internet Guide to Power Structure Research Network Analysis |
|
|
|
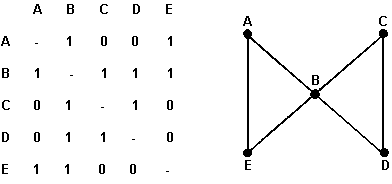
A Brief Introduction to Network Analysis Power structure research uses a variety of social science methods. Interviews and archival research are used to reconstruct the process by which important political decisions are made. Content analysis of speeches and written documents is used to clarify the political ideologies and issue positions of different fractions of the power elite. Survey research is used to estimate the objective social characteristics or subjective attitudes of elite populations. None of these methods is unique to power structure research. There is one method, however, that is widely used in power structure research but is less common in most other areas of social research. This method is network analysis. For those unfamiliar with the method of network analysis, the basic logic of this approach is quite simple (for an easy to follow introduction, see John Scott, Social Network Analysis: A Handbook). First, the researcher identifies a population of "nodes" (actors, organizations, or events) that comprise a social network. Then he or she gathers data on all the ties or links of a certain kind among these nodes, for example, transfers of resources, common memberships, interpersonal connections, joint participation in events, etc. These data are arranged in an NxN matrix, which contains one row and one column for each node within the network and whose cells indicate the presence or absence of links from each node to each other node within the network. For example, in the illustration below the 1's in the matrix on the left (known as an "adjacency" matrix) provide a representation of the links in the diagram on the right (known as a "sociogram").
With such a small number of nodes, it is easy to see some of the basic properties of the network. For example, node B occupies a distinctive and relatively "central" position within the network with more ties than any other node. Nodes A, B, and E form a tightly connected "clique" in which every node is tied to every other node. The same is true of nodes B, C, and D. Node B provides a bridge between these two cliques, indirectly linking otherwise unconnected nodes. A quick count reveals a total number of six links out of a possible maximum of ten (the number of links that would have existed if every node had been directly linked to every other node). This equals 60 percent of the possible links (a percentage referred to as the "density" of the network). In an actual study of the power structure, links of this kind might represent ties between corporations created when a single individual sits simultaneously on the boards of directors of both companies. Such "interlocking directorates" have been shown to serve important functions as channels of communication and lines of cohesion and coordination within the power elite. Or they might represent ties among individual members of the upper class created through intermarriage, common schooling, or common membership in exclusive clubs. Or they might represent the flow of money from corporations to political candidates or from private foundations to policy planning organizations. In more complex forms of network analysis the links among nodes may be directed (e.g., from A to B) and/or they may be given a value other than one (e.g., to measure the number of shared directors or the amount of money transfered). With a larger number of nodes it is usually impossible to identify the structural properties of the network simply through observation. Instead, it is necessary to manipulate the underlying matrix with specialized software to reveal such properties as the overall density of links, the division of the network into relatively distinct cliques or clusters, the degree of connectedness or centrality of specific nodes, and so forth. The most widely use such software is Ucinet. The current version of the program, Ucinet 6, operates under Windows and can be purchased from Analytic Technologies. The program costs $40 for students, $150 for faculty, and $250 for non-academic users. A 30-day trial version can be downloaded for free. An earlier version of the program, Ucinet 4, is adequate for most basic kinds of network analysis and is also distributed for free (click on "Free/Miscellaneous" under the "Products" menu). Ucinet 4 is a DOS program, but it is completely menu driven and can be set up to run in a DOS window under Windows 9x and later. One of the attractions of network analysis is the possibility it affords for exploring or depicting social relations in a visually intuitive, graphical format. For a simple but useful online application that illustrates this feature of social network analysis, check out Muckety.com, where you can create interactive maps of linkages among powerful elites and organizations from politics, business, and the media. For more information on network analysis, visit the web site of the International Network for Social Network Analysis (INSNA). There you can find bibliographies and course syllabi on network analysis, full-text of articles on the topic, and information on network analysis software. Copyright © 2012 by Val Burris |
