![]()
The final exam will comprise 15 multiple-choice questions and some written answer questions.
The 15 multiple-choice questions will be in Quiz format, and will cover all the course material since the last Quiz (#3).
There will be two types of written questions; problem solving and essay type questions. You will be asked to answer a subset of these written answer questions. They will cover all the material from the course.
The essay-type questions will be on the implications of the physics concepts we have learned.... specifically how they impact our energy use and our environment. For example, I might ask you to describe the characteristics of a heat engine and give 2 real-world examples. Or you might be asked to draw a picture of the earth and its surrounding atmosphere and identify how energy is transferred across the atmosphere and what is responsible for the "greenhouse effect."
I give a (rather hard) worked example of a problem-solving question below.
Question) Energy is never created or destroyed... it is just converted from one form to another. Consider the pendulum shown below:
The pendulum bob, m, is held at point A, which is at height h above the lowest point of travel (B). Then it is let go. What will the bob's speed be at point B? (neglect air resistance).
Although this problem seems tricky at first, the principle of energy conservation makes it easy. Remember that energy is never created or destroyed, it is simply converted from one kind to another.
To solve this problem, we follow a set of steps:
1) So here is what we know:
Pendulum bob has mass, m. It is held at height, h. It is at rest (not moving) at point A.
We also "know" that, upon release, the pendulum will fall to point B and be moving as it passes through that point.
2) We want to know the bob's speed at point B. We would then know its velocity, as it would be moving horizontally to the left (the direction) at point B.
Want to know velocity , v, at point B
3) What are some useful relationships between mass, speed, height and velocity?
Again, think of how to describe the bob's energy at A & B. What kind of energy does the pendulum bob have at point A? Well, what happens if you let go of it?
That's right, it falls under the influence of gravity. It has gravitational potential energy (GPE) at point A. We know that its gravitation potential energy is given by:
mgh
Does the bob have kinetic energy (KE, energy in motion) at point A? NO, it isn't moving!
But at point B, the bob has kinetic energy, given by:
1/2mv2
Does the bob have GPE at point B? Strictly speaking, yes. I could cut the string holding it up. But if I don't plan to do this, then NO, it can't fall any farther.
4) Write down an equation relating what you have learned in 3).
So here's where energy conservation comes into play. The total energy at A, which is all GPE, must equal the total energy at B, which is all KE . So we can set the two above expressions equal to one another:
mgh = 1/2mv2
5) Manipulate the equation to get what you don't know on the left side and what you know on the right.
I want to know velocity, v. I have been given m and h. "g," the acceleration due to gravity at the Earth's surface can be looked up. (It is 9.8 m/s/s).
So first I'll reverse the equations (to get v on the left side):
1/2mv2 = mgh
Then I'll divide both sides by m:
1/2v2 = gh
Wow, m cancels. It must not matter (the speed will be the same, regardless of the mass of the pendulum bob). Now I'll divide both sides by 1/2:
v2 = 2gh
Finally, I 'll take the square root of both sides:
6) Check units.
"g" has units of m/s/s. h has units of m. g x h has units of :
(m x m) / (s x s)
The square root of these units is m/s, which is the correct unit for velocity.
7) Substitute numbers.
Well, I haven't been given any numbers. This is the "general form" of the relationship, meaning I can plug in numbers any old time.
8) Finished
What was interesting about this problem? The speed of the pendulum bob (mass) at the bottom depends only on the height at which I release it. It doesn't depend on the bob's mass.
![]()
As we have progressed through this course we have examined some of the phenomenon collectively known as "global warming" and considered how our understanding of global warming reflects the scientific process at work. Now, near the end of the course, we will re-examine global warming in more detail, using the conceptual models of various physics processes that we have constructed during the term.
![]()
We use models to study global warming.
Our understanding of the many atmospheric, ocean and Earth surface processes that affect atmospheric and oceanic temperatures has developed in small leaps over time, and enough is now known so as to construct models of how global warming might work. These models can be anything from conceptual pictures of, say, the greenhouse effect, to numerical models, programmed onto computers, that calculate temperature, wind speed and direction and water vapor content at various points and times within the Earth's atmosphere. What motivates us to build better models is the realization that, on the average, our atmosphere and oceans have been heating up during the past 100 years.
![]()
We follow a "scientific process" shown schematically in the next table. Be aware that there are many variations on the "scientific process" that are all useful.
Step
What we do
Observe phenomenon and identify key variables.
Map out what happens to whom, and how.
Make working hypothesis
Intelligently guess the relationship between variables. Predict outcomes of hypothetical situations.
Test hypothesis
See if our predicted outcomes were correct.
Refine hypothesis
Fix our hypothesis if it doesn't work. Refine it if it works, but doesn't correctly predict new outcomes.
Add tested/refined hypothesis to theory.
Incorporate new, tested hypothesis with others to form a "theory."
With global warming, this idealized "scientific process" outlined above is immediately subverted. In fact, global warming, really qualifies as a theory, relying on many, many hypotheses which involve linkages.
The initial hypothesis is that global warming is occuring. Other hypothesis map out relationships between, say, atmospheric CO2 concentrations and IR radiation capture in the atmosphere. Quite often it is impossible to test completely an individual hypothesis-- the entire World is a tough laboratory!
Models represent another tweak of the scientific process described above. Global warming computer simulations (models) are constructed to incorporate the relationships defined by tested/refined hypotheses. Models, then, represent state-of-the-art theory and, given the validity of the underlying assumptions (tested hypotheses), can predict future climate behavior.
![]()
The table below details some of the hypotheses underlying the theory of global warming.
(e.g., temperature; CO2, water vapor in atmosphere; rising sea level; 1% increase in global average precipitation; number of rabbits in Australia). 2) A roughly 1% increase in precipitation over the Earth's continents during the last century. Furthermore, while this continental-average increase may seem small, larger increases have occurred away from the equator ("high latitudes") while rainfall actually decreased on the average in tropical zones. The EPA site cites a NOAA study which points out that the incidence of concentrated rainfalls ("cloudbursts") has grown during the past century. This last pronouncement is interesting. It assumes that changes in rainfall measurement technology can be neglected or otherwise compensated for in characterizing changing trends in styles of rainfall. Rainfall in Eugene last year was well above average. However, officials totals were regarded with skepticism because recently deployed measurement technologies were found to be deficient-- they could not keep up with rain falling at a great rate. 3) Sea level has risen 15-20 cm over the past century, partly because mountain glaciers are melting at an increased rate. Another part of this rise is attributable to thermal expansion of oceans as their temperature increases. Finally, it is noted that some of this increase may also be attributed to increased transfer (pumping) from underground acquifers to oceans as runoff from irrigation. 4) Observe (exponentially?) increasing concentration of atmospheric CO2 at Mauna Loa observatory in Hawaii during the past 200 years. (Note that historic concentrations of CO2 during the past century have never reached recently-recorded values.)
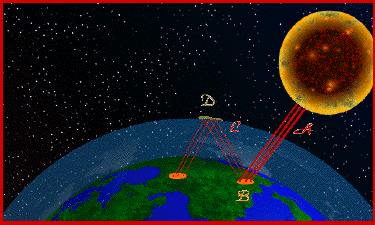
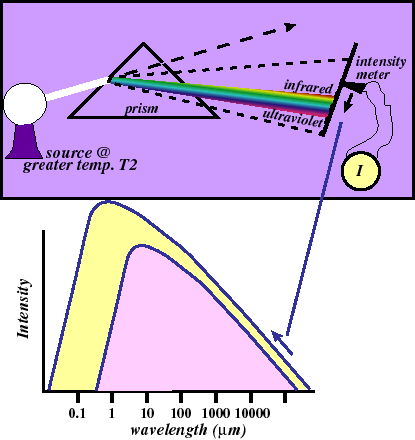
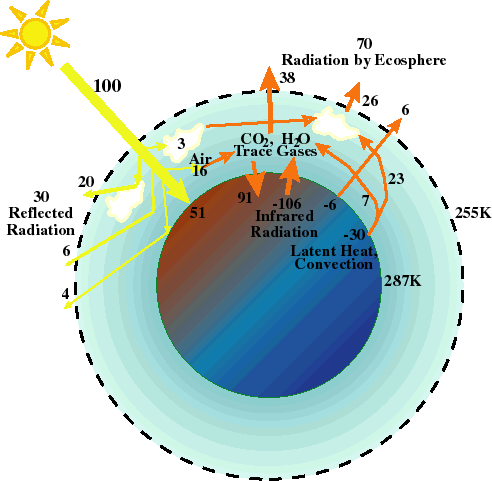
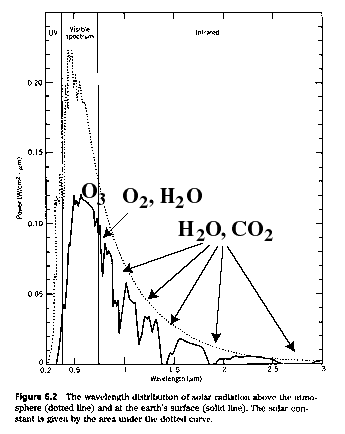
In light of the observations given above, a working hypothesis has been developed. A vastly simplified version of that hypothesis states that: Of course, we can do better than that. We can state more specifically that: But this, latter "hypothesis" simply states what appears to be obvious, and is hardly useful. By itself, this hypothesis gives no predictions for what will happen in the future. This hypothesis also dodges questions about the mechanisms by which global warming has occurred (and, thus, might continue to occur). Of course "we" (collectively: scientists and society) would like to develop a better understanding of global warming and sum up that understanding as a more refined working hypothesis. We would hope to then use that hypothesis to explain our observations and predict future climate. Along the way, we might hope to determine whether a change in humankind's technological activity is necessary, and whether Eugene will have, say, warmer and wetter winters and hotter and drier summers as a result of global warming. To further develop and refine our simple working hypothesis, we start by generating a conceptual model of how global warming works. This model comprises many physical, chemical, geological and biological processes; and they all interact with one another! The Greenhouse Effect: How energy from the Sun heats our atmosphere. The Carbon Cycle: How an important greenhouse gas, CO2, is regulated in the atmosphere, oceans and land masses. The Hydrological Cycle: How another important greenhouse gas, H2O vapor, is regulated within our atmosphere and oceans. 1) The Greenhouse Effect: How energy from the Sun heats our atmosphere. The figure below depicts what happens to solar radiation shining on the Earth (source: Energy by G. Aubrecht). Of 100 units of power, 30 are reflected back into space by clouds (20), air (6), and the Earth's surface (4). Of the remaining 70 units, 51 are absorbed directly by the Earth. The Earth radiates most of this absorbed energy at lower (infrared) frequencies, which are depicted in the top of the figure. Six units are emitted and escape directly to space. 106 units are absorbed by CO2 and water vapor in the atmosphere. Of this, 91 are then reflected back to and absorbed by the Earth. Also, some heat from the Earth (oceans) is utilized to lift air and water vapor into the upper atmosphere (there's that heat engine thing....). When water vapor and carbon dioxide are warmed, the atoms comprising molecules will radiate away any excess thermal energy in all directions. Some of the 91 units that are reabsorbed by the Earth originate in this phenomenon, as do the 38 units that ultimately escape back into space as IR radiation. 2) The Carbon Cycle: How an important greenhouse gas, CO2, is regulated in the atmosphere, oceans and land masses 3) The Hydrological Cycle: How another important greenhouse gas, H2O vapor, is regulated within our atmosphere and oceans. Why is this important to global warming? Dr. Richard S. Lindzen of M.I.T. believes that water vapor plays a more important role than atmospheric CO2 in regulating greenhouse effects. If Dr. Lindzen's ideas are correct, processes that transfer water vapor to and from atmosphere, and within the upper and lower atmosphere, must be understood and included in a grand model for global warming. Here's another web site giving background about the world hydrological cycle related to global climate change. Some of the hypotheses useful for global warming can be tested with small experiments. Many of the hypotheses, however, involve scales that are far to large to test in laboratories. Instead, we build computer simulations of temperature, greenhouse gas concentrations, air pressure, etc. at many points in the atmosphere and we "run" the simulation to tell us how those variables might evolve over time. As we determine that other processes (e.g., ocean/atmosphere CO2 exchange) are important to our outcome, we add bits that simulate them and their interactions to our computer simulation. These simulations will always be approximations to reality. And some of the same rules about experimentation apply to testing computer climate evolution models. For example, researchers must always be asking themselves: Global climate modelers test their models by starting the simulation some time in the past, using conditions based on past observations. They can run their simulations to the present time and check model outcomes against current observations. If they appear to have gotten it right, they can then let the model run into the future, predicting future temperature, etc. There are levels of detail that must be addressed. Most global climate computer simulations that are used today can "predict" current, globally-averaged temperatures starting from a given set of past observations. However, the regional details of the simulations may be quite different from current, known observations. For more information about global warming, check out this link.
Observation of physical phenomenon identification of key and unimportant variables
The U.S. Environmental Protection Agency (EPA) has a wonderful web site giving information about global warming. They identify four key observations that, taken together, strongly suggest that global warming is occurring.
1) A 0.45 - 0.6 degrees Celsius rise in globally-averaged land surface temperatures during the past century. Some argue that this trend only reflects a systematic change in measurement environments-- the continued building of massive, heat-storing structures around temperature observation sites has systematically affected temperature measurements such that they erroneously show an increase over time. The EPA site addresses this issue as follows:
Although scientists have incontrovertible evidence that the surfaces of the land and oceans have been warming, some scientists are not yet convinced that the atmosphere is also warming. The satellite data do not show a warming trend; however, the 1979-97 data series may be too short to show a trend in atmospheric temperature. So the EPA asserts that evidence of land surface and ocean (surface) warming is incontrovertible.

Formulate working hypotheses (which imply realizable "models" for the Earth's climatalogical system).
Initial Hypothesis
the Earth has been warming over the past century.
the Earth's surface and oceans (and atmosphere?) have been warming over the past century.
Refine and embellish hypotheses. Build models for different, important processes.
We won't try to develop a compete conceptual model for global warming here. However, several important processes have been covered in lecture.


The carbon cycle-- one of the biogeochemical processes whereby carbon is transferred between "active" and "storage" pools within rocks, oceans and the atmosphere-- is important to global warming. Attributes of this cycle which, among other things, moderates concentrations of CO2, are:
The hydrological cycle. This is another set of processes that cyclically removes fresh water from the oceans, transports this as water vapor through the atmosphere and over continents, where precipitation and runoff return i to the oceans.
Hypotheses testing (in lieu of direct experimentation, which is difficult to undertake on a global scale). This inevitably leads to more hypothesis refinement and further testing.
An important step in the scientific process is hypothesis testing. Typically this involves careful construction of experiments where key parameters (e.g., atmospheric concentration of CO2) can be varied and its affect on the experiment's outcome can be measured. Ultimately, the relationship between that variable and, say, global temperature would be determined and, perhaps, represented as a mathematical expression.
Result of study
In the case of global warming, the final product would be a trustworthy computer simulation providing: