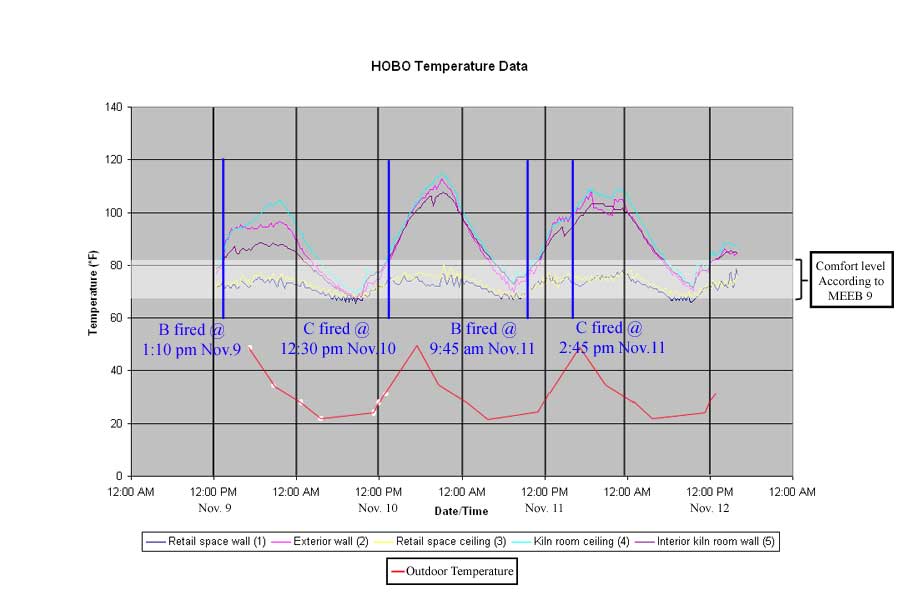
fig. 24
graph of collected HOBO temperature data
BACK