
A Vital signs case study of Brush-Fire Pottery
|
|
|
|
|
|
| Conclusions |
Learned |
|
Acknowledgments | Appendix |
Figure 24 shows a graph of the temperatures gathered from the HOBO's and the exterior temperatures retrieved from the Internet. Vertical blue lines indicate the beginning of the kiln cycle (table 2). Peaks of the room temperatures lag behind peaks in outdoor temperature as expected; there is little or no deviation from usual incident solar radiation temperature lags.
Table 3 includs the total R-values for the building materials and Table 4 contains the estimated heat gains.
Figures 25 and 26 are graphs of the pyrameter readings, showing surface temperatures of the interior and exterior North wall. Dark Blue represents the coolest surface temperature; red, the hottest.
The information gathered regarding heat gains and losses was only somewhat informative. Immediately, we determined that our hypothesis was flawed, as it appeared that the roof of the kiln room was indeed well insulated. Also, though we determined R-values of building materials and found that the roof was better insulated than the walls, such information did little to tell us where else the heat could be escaping.
To answer this, the HOBO information was only slightly more informative. From Figure 24 it is easy to see that the heat was not escaping into the studio space, as the temperatures on the studio side of the dividing wall stayed fairly constant, fluctuating only 11 degrees F. However, all of the temperatures recorded inside the kiln room were very similar. The ceiling was, in fact, hotter than any of the surrounding walls, but only by as much as 3 degrees F at any given time. We did not feel that such a slight increase in temperature at the ceiling necessarily proved or disproved our hypothesis. At this point, we decided to gather additional information.
We assumed that if the heat was not escaping through the roof or into the studio space, it was leaving via the exterior (North) wall. Therefore, we used the pyrameter to record surface temperatures of the exterior of that North wall (Figure 3). We found that the outside surface temperature of the wall was greatest at the kiln exhaust vent (which did not account for the loss of radiant heat from the kilns). The next highest temperature was at the open-air vent. This suggested that the heat radiated from the kilns was lost directly to the outside via the open vent.
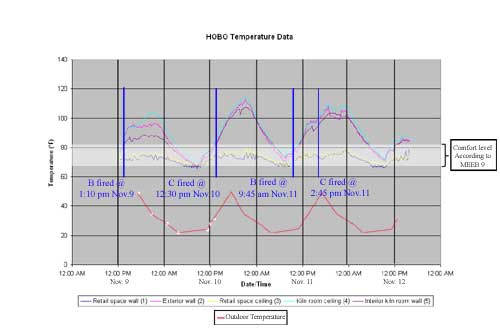
fig. 24
graph of collected HOBO data
| Date / Time | |
| Kiln B | Nov. 9 @ 1:10 pm |
| Kiln C | Nov. 10 @ 12:30 pm |
| Kiln B | Nov. 11 @ 9:45 am |
| Kiln C | Nov. 11 @ 2:45 pm |
Kiln firing log
| Total R-values | |
| N and W walls | 22.43 |
| S and E walls | 22.13 |
| roof | 17.83 |
| floor | 2.09 |
R-values
| Internal Heat Gains | |
| Occupants (2) | 1100 Btu/hr |
| Lights | 1330 Btu/hr |
| Kilns (3) | 39,308 Btu/hr (each) |
Internal heat gains
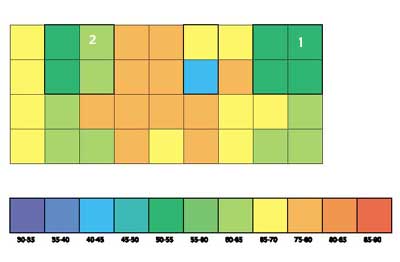
fig. 25
interior pyrameter results of
the north wall

fig. 26
exterior pyrameter results of
the north wall