Constellations of Mathematics
Nitan Avivi, Gabby Bennett, Chloe Miller, Azusena Rosales Suares, and JJ Thomas
 |
 |
 |
 |
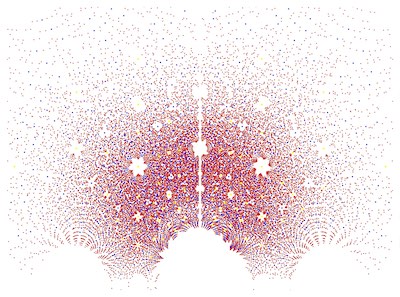
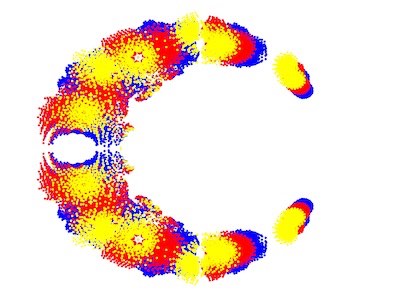
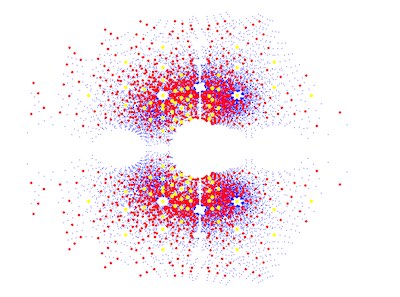
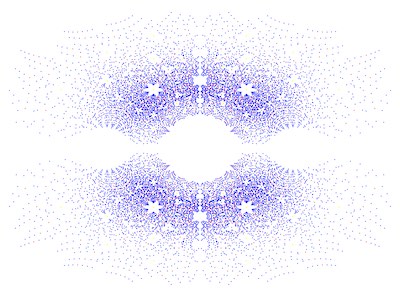
Images created by Nitan Avivi (upper left), Gabby Bennett (upper right), Chloe Miller (lower left), Azusena Rosales Suares (lower right)
Have you ever looked up at the stars in a city? The bright lights in the city make it harder to see all the stars, but you know they are out there. No matter where we stand and look up at the sky at night, we cannot see all the stars, even though we can sometimes see more and more of them filling the sky. Likewise, when we plot roots of families of polynomials in the complex plane, we see interesting patterns, but there are always infinitely many more roots of polynomials. The stars have patterns called constellations. Here, we see constellation-like patterns in the roots of families of polynomials. Just as we cannot cover all the stars in one glance to the sky, we have in this case restricted the ranges of the coefficients of the polynomials to focus on individual “constellations” our eyes can see.
For the more mathematically inclined, did you know imaginary numbers are actually real? Despite their name, imaginary numbers are necessary to solve problems related to fluid dynamics and electrical currents. The also show up in the "constellations" in our project. In this project we have decided to plot roots, otherwise called zeros, of families of polynomials with integer coefficients and explore their patterns in the complex plane. The visual representations in the complex plane of the roots of the families of polynomials have symmetrical patterns along the real-axis, unlike the symmetry across the imaginary-axis which is not always true. This is an interesting topic because symmetry is a characteristic pattern easily recognizable and is appealing to the eye. It’s intriguing how the graphs are composed and what could influence the visual representations. This interest led to our findings on how we could actually make a visual indication of symmetry across both axes in the complex plane. As a result, we created variations within the properties of symmetry.
Before we take you too far into our findings of ways to make asymmetrical images, let us give you some important history of our topic at hand. Take a moment to imagine what it would be like to live in a silent world. Now, what would you say if I told you a mathematician used the word "deaf" to describe a certain type of number? This mathematician and engineer is Rafael Bombelli who lived in the late 1500s. Bombelli was an important figure within the history of complex and algebraic numbers because he wanted to share their importance with others who were not mathematicians and make his work more accessible to others. As a group, our goal is to share our work in a way that is more accessible. As for his “deaf number”, he referred to irrational square roots as "deaf" to mean that the numbers were impossible to name. An irrational number is one that can't be written as a fraction, and an irrational square root happens when we take the square root of a number and the answer we get is not a fraction. For example, the square root of 4 is 2 (a whole number), so this is not irrational. While the square root of 2 is not a perfect square and its square root cannot be written as a fraction and therefore is an irrational square root because the decimal places never end. Bombelli also discovered how to work with complex numbers in order to solve all forms of cubic equations.
Now let’s get into our visuals and explain what you are seeing in each image. First, you may notice there are no points on where the axes would normally be. This was mainly for aesthetic purposes, as there were a lot of points on the axes and they were not what we wanted to focus on in this project. In Constellations 1 through 3 the color meanings are the same. They have three different colored plot points: blue, red, and yellow. A color is the representation of the roots, meaning that that point is a possible solution zero for a polynomial to the respective degree (family). The Constellation that doesn't follow this color scheme is Constellation 4. For this Constellation the colors used are red, blue, yellow, and green. Below is a table of the color meanings for each Constellation.
Color Meanings for Constellations
|
Constellation # |
Color for degree 1 |
Color for degree 2 |
Color for degree 3 |
Color for degree 4 (if applicable) |
|
1 |
Blue |
Red |
Yellow |
|
|
2 |
Blue |
Red |
Yellow |
|
|
3 |
Blue |
Red |
Yellow |
|
|
4 |
Red |
Blue |
Yellow |
Green |
Another important aspect to the visuals is the range of coefficients that are within each visual, this is a key factor to the symmetry or lack thereof as explained later. Below is a table of the range of coefficients used in the code for each of the Constellations.
Ranges of Coefficients for Constellations
|
Constellation 1 |
Constellation 2 |
Constellation 3 |
Constellation 4 |
|
(-3, 4) |
(-4, 1) |
(2, 4) |
(-3, 6) |
Additionally, another main aspect to the visuals is the maximum degree of the coefficients. The higher the maximum the degree, the more dense and widespread the plot becomes due to the higher amount of roots in the polynomial. Below is a table of the maximum degree of the coefficients for each Constellation.
Maximum Degree of Coefficients
|
Constellation 1 |
Constellation 2 |
Constellation 3 |
Constellation 4 |
|
4 |
4 |
10 |
4 |
Lastly, another aspect that is changed is the size of the plot points. This was done in Constellation 2 to add more visibility to the plot points that showed up less frequently than others.
One way to manipulate the polynomials is by changing the range of available coefficients. By changing the range, we can directly change whether or not the image is symmetrical across the imaginary axis. For example, in the symmetrical image (Constellation 1) that we used as a basis to compare, the range of coefficients in the code was in range (-3, 4), which means that the coefficients were ranging from -3 to 3. In this case we can see that there are just as many positive coefficients as negative coefficients. When this happens, the image will be symmetrical across the imaginary axis. And when there are more negative coefficients than positive coefficients or visa-versa, the image will not be symmetrical. Images that are only slightly asymmetrical across the imaginary axis have less of a disparity between negative coefficients and positive coefficients. The greater the disparity between positive and negative coefficients the greater the effect we can see on the symmetrical properties across the imaginary axis.
Another important mathematician to contribute to the roots of polynomials of high degrees was Évariste Galois, a French mathematician who was alive in the early 1800s. Interestingly Galois died in a duel in 1832, and his findings were published only after his death. One of his biggest contributions in mathematics is the creation of an entire field named after him, Galois Theory (Goodman). Galois theory states “that the symmetry properties of the conjugate roots are nicely reflected in [polynomials]” (Mazur 16). The term “complex conjugate” was introduced by Cauchy in 1825, but Rafael Bombelli (1526-1572) discovered the method in the 14th century (Richeson). In our visualization, taking the complex conjugate of a number means to reflect it across the real axis. If a complex number forms an angle from the real axis, its conjugate will form the negative angle (Soto-Johnson). In other words, the non-real roots of polynomials will always come in pairs as long as the coefficient are real numbers (the complex conjugates). This also implies that all of the possible polynomials used to plot roots in the complex plane will have an automatic symmetrical pattern across the real axis. While there is symmetry across the real axis, the symmetry across the imaginary axis depends on the polynomials and their coefficients. The leading coefficients are indicators of the symmetry across the imaginary axis, therefore the range of coefficients is important (Emiris and Tsigaridas).
We decided to explore the topics of conjugates and repulsions as well after seeing their impact in the possible symmetry of the visual representations. One thing we noticed is the lack of roots near the real axis. This is due to the principle of repulsion which in summary states that, "There is ‘repulsion’ from the real axis for non-real algebraic numbers which increase inversely with the size of the imaginary part" (Goetze). This means that roots that are complex (imaginary) are away from the real axis, which can create a circular shape and an array of points (roots) which are dispersing and stretching outward as seen in some of the images.
The repulsion is a product of something called Diophantine approximation, which uses properties of some types of numbers to approximate and categorize others. For example, recent research in Diophantine approximation suggests that aspects of the roots of unity are why we get that big empty circle in the center. They also help to explain the islands around the values that lie on the circle of radius one. Zaussenhaus’ conjecture says that the roots of a polynomial are plotted at a distance of , d being the highest degree of the polynomial outside the roots of the unit circle. This could explain why as the max degree increases, the points on the plot not only become denser but are closer to the circular shape in the middle of the graph and gather more densely around its edges.
Related Courses at the University of Oregon
These are some courses offered at the University of Oregon that can help you better understand the field of this subject:
- Math 199: Math and the Creative Process: A Participatory Exploration of Number Theory
- Math 203: Analysis and Number Theory Math Lab
- Math 347: Fundamentals of Number Theory I
- Math 348: Fundamentals of Number Theory II
- Math 391: Fundamentals of Abstract Algebra I
- Math 392: Fundamentals of Abstract Algebra II
- Math 444: Introduction to Abstract Algebra I
- Math 445: Introduction to Abstract Algebra II
- Math 446: Introduction to Abstract Algebra III
Bibliography
Baez, John. "The Beauty of Roots." http://math.ucr.edu/home/baez/roots/
Emiris, Ioannis Z., and Elias P. Tsigaridas. “Real Algebraic Numbers and Polynomial Systems of Small Degree.” Theoretical Computer Science, vol. 409, no. 2, 17 Dec. 2008, pp. 188–189. Free E-Journals, doi:10.1016/j.tcs.2008.09.009. Accessed 24 May 2020.
“Galois Theory.” Galois Theory - Encyclopedia of Mathematics, encyclopediaofmath.org/wiki/Galois_theory. Accessed 20 May, 2020.
Goetze, Friedrich, et al. “Distribution of Complex Algebraic Numbers.” ResearcrGate, American Mathematical Society, 14 Oct. 2014, www.researchgate.net/publication/266913200_Distribution_of_complex_algebraic_numbers. Accessed 23 May 2020.
Goodman, Dan. An Introduction to Galois Theory. Feb. 2011, nrich.maths.org/1422.
Mazur, Barry. “Algebraic Numbers.” The Princeton Companion to Mathematics, 2010, http://people.math.harvard.edu/~mazur/preprints/algebraic.numbers.April.30.pdf. Accessed May 5, 2020.
O'Connor, J J, and E F Robertson. “Rafael Bombelli.” Rafael Bombelli (1526 - 1572), School of Mathematics and Statistics University of St Andrews, Scotland , Jan. 2000, mathshistory.st-andrews.ac.uk/Biographies/Bombelli.html. Accessed May 5, 2020.
Richeson, David S. Tales of Impossibility: The 2000-Year Quest to Solve the Mathematical Problems of Antiquity. Princeton University Press, 2019.
Soto-Johnson, Hortensia. "Visualizing the arithmetic of complex numbers." The International Journal for Technology in Mathematics Education, vol. 21, no. 3, 2014, p. 103+.
These students' description has been lightly edited for clarity.