Perihelion
Cruz Godar
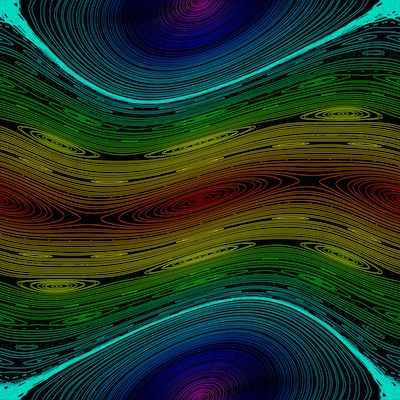
Pour enough heat into anything and it'll descend into chaos. But what if we just got close — what does the boundary between order and chaos look like? It's a little unclear what we're even asking here, but it turns out math is well-equipped to provide an answer. We can see an example of such a boundary in the Kicked Rotator. It's a beautiful-looking image that resembles something like tidal flow, and in fact, that's not too far off. It plots the angle and momentum of a pendulum that sits in an antigravity chamber — but one where we turn the gravity on and off periodically. Loops and paths in the image here represent a change in the pendulum's angle and momentum over time — so if it's at a point on a red loop in the center, it will never reach a green point, no matter how much time passes. That cyan band that looks thicker than the others indicates some chaos — the pendulum is moving between many more states than a line's worth.
But this picture before you isn't the Kicked Rotator — it's just one of them. By varying the strength of the gravity, which we represent with the letter K, we can alter the paths the pendulum takes. The higher K is, the more chaotic the system gets, until chaos begins to take over completely at around K=.97, obliterating all structure by K=2. And so these Kicked Rotators give us a glimpse of a transition between order and chaos, with one slowly overtaking the other. It's a beautiful testament to the fragility of systems like these — especially when our universe is little more than a massive dynamical system itself.
If you want to explore Kicked Rotators for any value of K, have a look at the applet here.