Prime Invasion
Derek McBride
Prime Invasion, exhibited on the JSMA’s screen, gives a visualization of one of the many patterns that come into play when analyzing the distribution of prime numbers. I chose this topic because I always loved looking for patterns, whether it was a picture on Facebook or an extra credit assignment in class. I especially enjoyed finding patterns in aspects that seemed to have no patterns at all.
Even though the behavior of prime numbers seems to be random and sporadic, it does show slight patterns and relationships that allow mathematicians to better understand what exactly is going on. This is what made the distribution of prime numbers perfect for me.
There have been many historical contributions to how prime numbers behave, but one of the first people who made a significant contribution to this topic was a man called Euclid (323-285 B.C) who first proved that there were infinitely many prime numbers. Many other people like Carl Friedrich Gauss made contributions to prime numbers, specifically how they relate to modular arithmetic.
Describing the math...
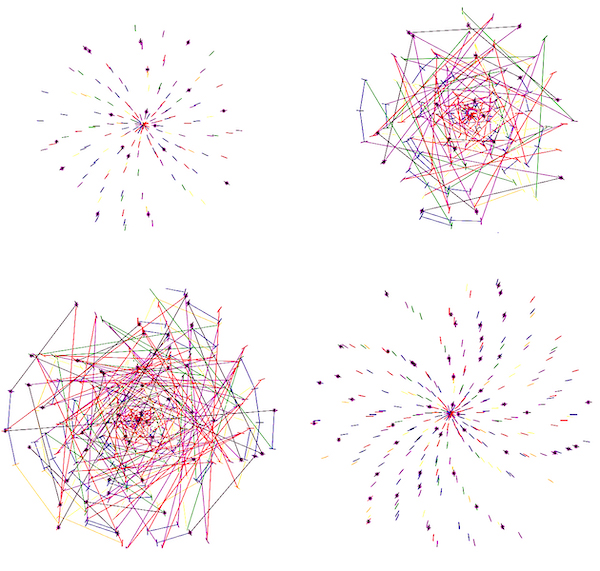
These images are mostly based on polar coordinates. That is, instead of having a traditional x and y coordinate, we have both an angle and a distance. In this case, after the code used to make this image identifies a prime number, it plots it in the polar coordinate plane where the prime number becomes both the angle in radians and the distance in pixels (multiplied by a scaling factor to fit appropriate size). For example, when the code identifies 17 as a prime number, it plots the point (17,17) on the polar coordinate plane meaning it will rotate 17 radians counter-clockwise from 0 radians and then go out to 17 pixels to plot a point.
The colors used in the image also serves a purpose by identifying the distance between every two consecutive primes. Specifically, the color depends on whether the difference between two consecutive primes is equal to 2,4,6,8,10,12 (the 6 most common distances), or whether the distance is greater than 12. This is easier to see in the sub-images that have connecting lines. For example, if the difference between two consecutive primes is equal to 2, then the color becomes red (view the table at the bottom to view other distance colors). You may find that even though prime numbers that have a difference of two are closer together than prime numbers that have a difference of six, it seems that, in the images, the prime numbers that have a difference of six are always closer together than other prime numbers. The reason for this is found in the way the prime numbers are plotted. Since the prime number will represent both the angle in radians and distance, the prime numbers with a difference of six are plotted 6 radians apart from each other. When converted to degrees, this equals about 344 degrees which is almost a full turn meaning the plots of the prime numbers with a difference of 6 will be plotted nearly in the same spot. You may also notice purple 8-pronged stars plotted on certain prime numbers. These stars help mark all the consecutive prime numbers whose difference is greater than 12. For example, the distance between the consecutive primes 887 and 907 is 20, which is greater than 12, so the code used to make this image would go back and put a start on both 887 and 907 to mark this occurrence.
| Distance: | 2 | 4 | 6 | 8 | 10 | 12 | 14 or more | Color | Red | Purple | Blue | Green | Yellow | Orange | Black |
Related Courses at the University of Oregon
Classes on proofs or number theory like Math 347 and 348, Fundamentals of Number Theory 1 and 2, would be great classes to take in order to better understand and learn more about this topic.
This student’s description has been lightly edited for clarity.