Morgan-Keenan (MK) Spectral Classification
 |
Morgan-Keenan Spectral Classification
(O,B,A,F,G,K,M, hi to lo T)
|
Based on the appearance of the spectra of stars,
a spectral classification scheme
was devised in the late 1800s and the
early 1900s at Harvard in a group led by Annie Jump
Cannon. The criteria used to define
the sequence were based primarily
on the strengths of the hydrogen Balmer lines
but
other features were also considered.
Today, other criteria are used and so the
ordering is rather more
obscure. The ordering is O, B, A, F, G, K, M
.
This is a
temperature sequence starting from the hottest stars at
O going to the coolest
stars at M.
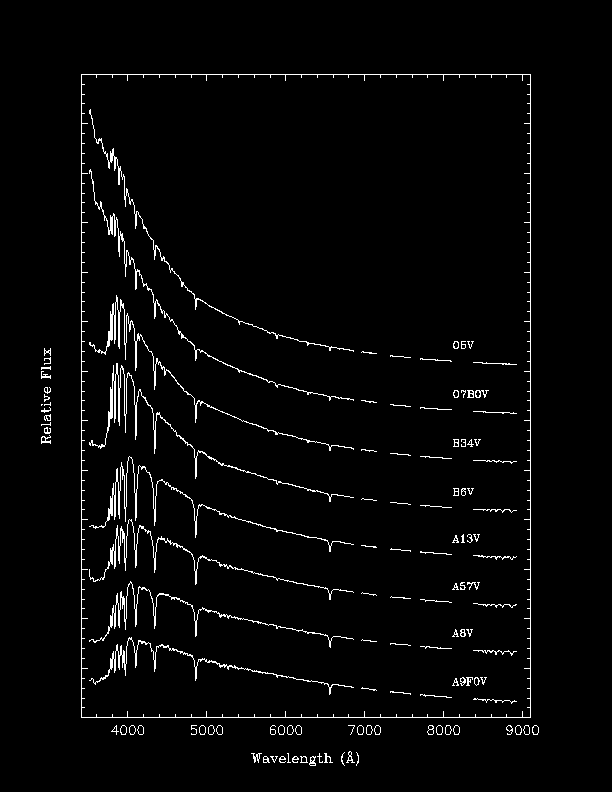
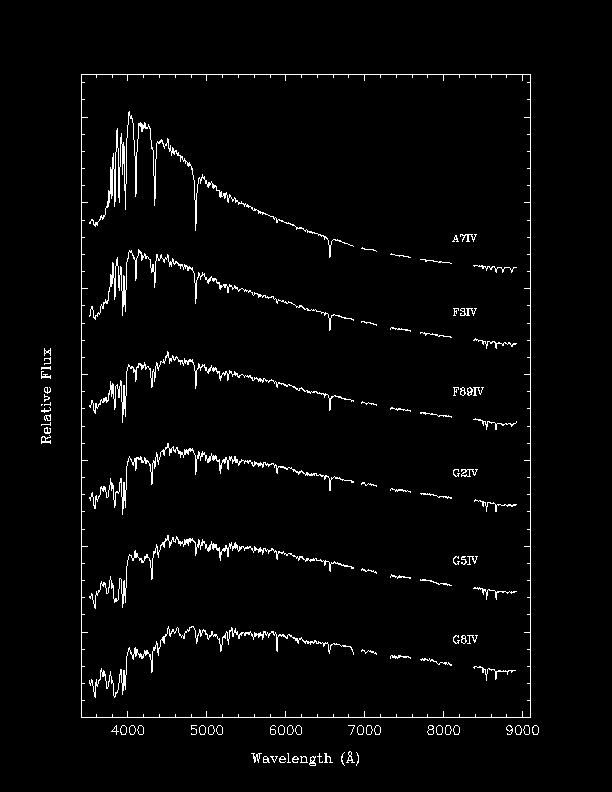
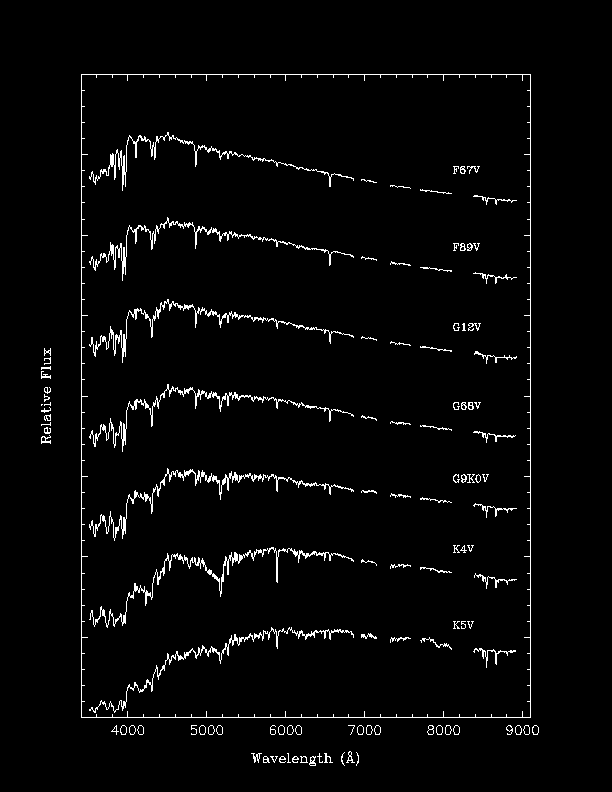
Examples of Stellar Spectra
Note that different spectral lines are seen and that the
strengths of the lines are quite different.
Below is
a rough description of the spectral classes:
Spectral Class | Temperature | Comments |
O | 28,000-50,000 K | ionized atoms, especially helium |
B | 10,000-28,000 K | neutral helium, some hydrogen |
A | 7,500-10,000 K | strong hydrogen, some ionized metals |
F | 6,000-7,500 K | hydrogen and ionized metals, such as calcium and iron |
G | 5,000-6,000 K | ionized calcium and both neutral and ionized metals |
K | 3,500-5,000 K | neutral metals |
M | 2,500-3,500 K | strong molecular lines, e.g., titanium oxide, and some neutral calcium |
We know that the chemical compositions of most stars are
roughly the same, why do stars show such different spectra? To
clear up this point, we discuss the hydrogen lines.
Formation of the Hydrogen Lines
The hydrogen lines are weak in cool stars,
increase in strength as the temperature
increases, reach a peak around the A stars, and then weaken at higher
temperatures.
Question:
Why don't all stars show strong hydrogen lines
if hydrogen is the most abundant element in the Universe?
The reason has to do with the energy level structure of hydrogen and the
temperatures of the stars.
- Because electrons are a lazy sort, they like to reside in the lowest
energy level. If they are in a higher state (excited state), they
quickly return to the lowest state (the ground state). The only
way to populate an excited state is for collisions with high energy
particles (other atoms or electrons) or absorption of photons to occur
rapidly enough to overcome the tendency for all things to reside in the
ground state.
- For cooler stars, the electrons in most hydrogen atoms are in
the ground state. Therefore, if an absorption occurs, a
Lyman line is produced. Because Lyman lines correspond to
large transitions, the lines fall in the ultraviolet
and will not appear in the optical
portion of the spectrum. As a result, in cool stars one does not see
strong hydrogen lines, because not enough electrons reside in the n = 2
level.
- For warmer stars, the number of electrons which can be pushed into
the n = 2 level increases and consequently, the number of absorptions by
electrons in the n = 2 level increases (stronger Balmer lines are
produced). Balmer transitions are less energetic than
Lyman transitions and fall in the optical portion of the
spectrum.
- The strength of the hydrogen lines does not increase forever,
however. Why not? Well, once stars start to get hot enough, the
collisions between hydrogen atoms and photons (and perhaps with
some particles) in their atmospheres are so energetic that they
will liberate electrons, that is, the atoms become
ionized. Since lines are produced by electrons changing energy states,
if an atom has no electrons then it cannot produce lines! Because of
this, in the very hottest stars, hydrogen lines are not seen.
The competition between excitation and ionization leads to the maximum
hydrogen line strength in stars with T roughly 8,000-10,000 K, A
stars.
Similar arguments can be made for the other lines seen in
stellar spectra.


