 |
SPECTRAL ANALYSIS: LINES AND MK SPECTRAL CLASSIFICATION
|
We have just barely scratched the surface of how astronomers
utilize stellar spectra to reveal the properties of stars.
For the next few lectures we
will investigate how stars produce their spectra and
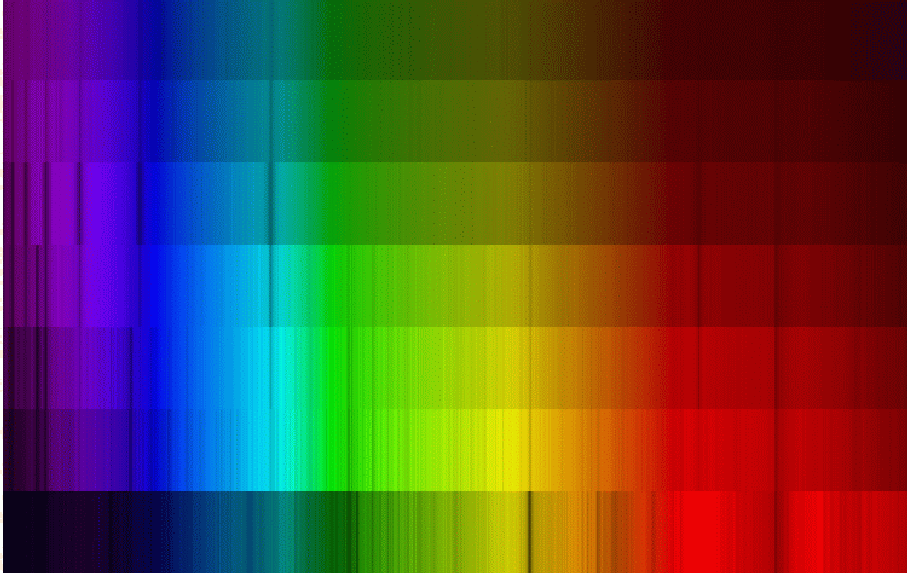
how information is extracted from stellar spectra. In the left panel above,
a series of stellar spectra are shown from hot stars to cool stars. We can
see immediately that the color of the stars shift from bluish to reddish and
that different series of dark absorption lines appear. We have already
pointed out why the color changes;
the wavelength at which the
star appears the brightest
depends on its temperature. The
hotter is the star, the shorter the wavelength at which its emission peaks.
This is often times quantified using Wien's Law, the property of a blackbody radiator
star that explicitly states how the wavelength of blackbody emssion depends inversely
on the temperature of the blackbody.
For the next lecture we discuss how we also determine the surface temperature
of stars using the line spectrum of the star. We pay particular attention to
why the absorption line patterns differ from star to star. We will cover:
- Spectral Formation--Kirchhoff made three statements about spectral formation
in stars that have become known as Kirchhoff's Three Laws of Spectral
Formation. Kirchhoff's laws allow one to predict the type of spectrum
an astrohysical object is
likely to produce, a hot dense gas produces a
continuous spectrum, a hot dense gas with a cooler
gas sitting on top of it produces an absorption line spectrum
and a hot gas sitting by itself produces an
emission line spectrum.
- Spectral Analysis--
Based on the early experiments of Bunsen and
Kirchhoff, and the theroretical work of
Bohr, it was
learned that the wavelengths (energies) of the spectral
lines for particular
elements were the same every time they were measured
and the patterns of the lines were unique to individual elements.
Atomic lines
serve as fingerprints for atoms.
We understand why this is true because of the pioneering work of
Niels Bohr
and many other workers in the field of
Quantum Mechanics
which elucidated the structure of atoms.
- Spectral Classification--Stellar spectra
were organized in a Spectral Classification
scheme developed in the late 1800s and early 1900s
by Annie Jump Cannon and co-workers at Harvard.
The scheme was based primarily on the appearance of the absorption lines
produced by hydrogen with the stars beoming ranked according to their
surface temperatures. Annoyingly, the scheme ranked
stars in order of decreasing surface temperature ranging from
30,000-50,000 K to 2,500-3,000 K. In
the scheme, the
ordering of the Spectral Classes is O, B, A, F, G, K, M.
The seemingly random ordering reflected the fact that
temperature determined
the differences in the appearance of the stellar spectra and
was not because stars were made of different materials.
With the realization of the pre-eminent role of temperature, it became clear
that most stars are eseentially made of the same things, hydrogen, helium,
and small amounts of everything else! In this schene, the Sun has
classification G2. G stars have temperatures
ranging from 6,000 K to 5,000 K, the 2 means that the Sun
is around 0.2 of the way from G to K (the next spectral class),
T around 5,800 K.


