We covered basic data analysis using SPSS in class. To assist in learning the application, I suggest you work through the following exercises. You are not required to complete the exercises; however, you’ll need to understand basic analytical procedures to work with your project data set. Be sure you have your copy of the survey instrument handy—you’ll need it to interpret the variable names.
- Run SPSS
- Open the CoosBike.sav file in the SPSS editor
- Double-click on the Q1 variable to view the variable definition. Click on the Labels button to view the label code definitions. Note that Q1 values are ordinal and gauge the respondent’s level of support for tourism as an economic development tool. Click OK to close the define label window.
- Now you’ll view a frequency distribution for Q1. To do this, select Statistics, then Summarize. Now select the Frequencies option from the summarize menu. SPSS displays a list of variables; select Q1 from the list on the left, then click on the arrow to add it to the list of frequency variables on the right. Click OK to run a frequency distribution for Q1. Notice that SPSS displays the results in a separate window called the SPSS Output Navigator (look at the Task Bar at the bottom of your display). You can continue to conduct your data analysis using the Output Navigator or you can move back to the SPSS Data Editor.
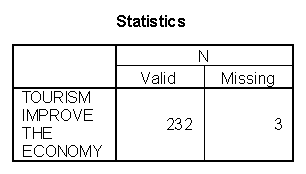
The first table displays statistics; in this event it shows the number of valid and missing cases for Q1.
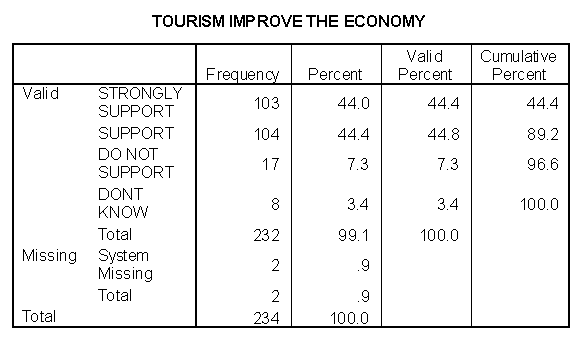
The second table shows the frequency distribution for Q1:
Note the frequency, percent and valid percent columns. The valid percent is the percentages without the missing cases.
- In this example, you will include statistics and a chart with your output. You can either run the next analysis directly from the SPSS Output Navigator or from the SPSS Data Editor.
From the SPSS Output Navigator select Statistics, then Summarize. Add Q2 to the list of frequencies. Now click on the Statistics button. Select all of the Central Tendencies options and all of the Dispersion options. Now click Continue. Next, click on the Chart option. Select the Bar chart type and then click. Now Click OK from the main frequencies window. SPSS displays the statistics, the frequencies, and a bar chart of your data.